Our View
I got my 50 to 70-point ES pullback, but based on all the headlines I’m not sure this is over. We all know Xi and Putin get along to some degree, as China and Russia have become allies on many fronts. I think the US is heading for a big reality check; we can no longer be the global sheriff.
Covid-19 unhinged the public and shut down businesses around the globe, causing unrest, demonstrations and rioting — all the things Russia and China like to see. Maybe I’m a little off on this, but I think we are being goaded into a war. I am not saying today or tomorrow, but the odds are on the rise as tensions continue to climb.
I want to write about the stock market and the S&P, not geopolitics. But unfortunately, the latter is going to impact the former and it’s something we have to keep an eye on. Whatever happens, we all know one thing: The S&P hates uncertainty and currently, uncertainty is on the rise.
For what it’s worth, former Goldman Sachs prop trader Cyrus and a MrTopStep member said that you’re always supposed to buy the dip on global events like this.
Our Lean
I have always felt something big was going to happen this year and I’m hoping it’s none of the above. Tonight/today’s trade will be filled with threatening China headlines. I suspect that today could be like yesterday.
I want to take a guided approach, meaning trade less and pick my spots better. I think the big resistance comes in at 4140 to 4150. On the downside, I’m watching 4070 to 4076, 4040 and 4020.
Keep an eye on the 4108 area. This is a key pivot to me. If we dip to this level on the open, I want to see if it holds and give us a scalp on the long side.
I’m back to selling the rips and buying the dips, but widening out my ranges. Also, this is no time to hold losing positions, use stops and learn to live another day.
Daily Recap

Tuesday’s action was filled with 20 to 30 point rips and dips. The ES opened at 4103.75, traded up to 4110 at 9:33, then sold off down to regular session low of 4080.50 at 10:10.
From there, it rallied 46 points up to 4126.50 at 10:55, pulled back 20 points and 11:32, then rallied to the regular session high up at 4143 at 12:52 when the Pelosi headlines started hitting. The ES coughed up 44 points on the dip but found its footing near 4100 and gave bulls a 20 point rebound back up 4121.
From there, the ES traded down to 4096.50 at 3:21 as the early MIM showed $265 million to sell. After a small uptick, the ES traded up to 4112.50 at 3:37 and dropped 10 points down to 4099.50 as the 3:50 cash imbalance showed $450 million to buy. The ES traded down to 4092 at 3:59 and traded 4094.25 on the 4:00 cash close. After 4:00 the ES sold off down to 4089.25 at 4:09 and settled at 4096.25 on the 5:00 futures close, down 26.75 points or 0.65% on the day.
In the end, the Pelosi/China news weighed on the ES all day. In terms of the ES’s overall tone, it was ‘skittish.’ In terms of the ES’s overall trade, volume was higher than Monday, at 1.85 million contracts traded.
- Daily Range: 62.5 points
- H: 4143
- L: 4080.50
Technical Edge
- NYSE Breadth: 47% Upside Volume
- NASDAQ Breadth: 65% Upside Volume
- VIX: ~$23.25
Game Plan: ES Futures, S&P 500, NQ Futures
Our list of individual stock trades triggered a few entries yesterday, notably CHNG and UUP, which will be included in the Go-To Watchlist below.
Other than that, the ranges simply continue to tighten. Either we push through resistance after a short rest or we pullback some more and test support.
S&P 500 — ES

Over the last three days, the ES has topped out within a 4-point range. Those highs are 4144, 4147.25 and 4143. So it’s safe to say that, at the moment, resistance is in the 4140 to 4150 zone.
It’s also safe to argue that there are likely stops building above this level.
The 61.8% retrace from the Globex lows to yesterday’s high is 4119 — call it 4120. If we can clear and hold above that, I could see the ES pushing the 4140s again today. If we do clear this zone today or this week, it could set the stage for a push up to 4189 to 4200 (the June high being the former).
On the downside, 4080 has been support. A break of this area could thrust the 10-day into play, then the 4000 level.
S&P 500 — SPY

The SPY had a nice bounce off $407 yesterday, but faded from the three-day high around $413.
If we lose $407, it opens the door to the 10-day moving average and the $400 level. Below that puts the low-$390s in play.
Nasdaq — NQ
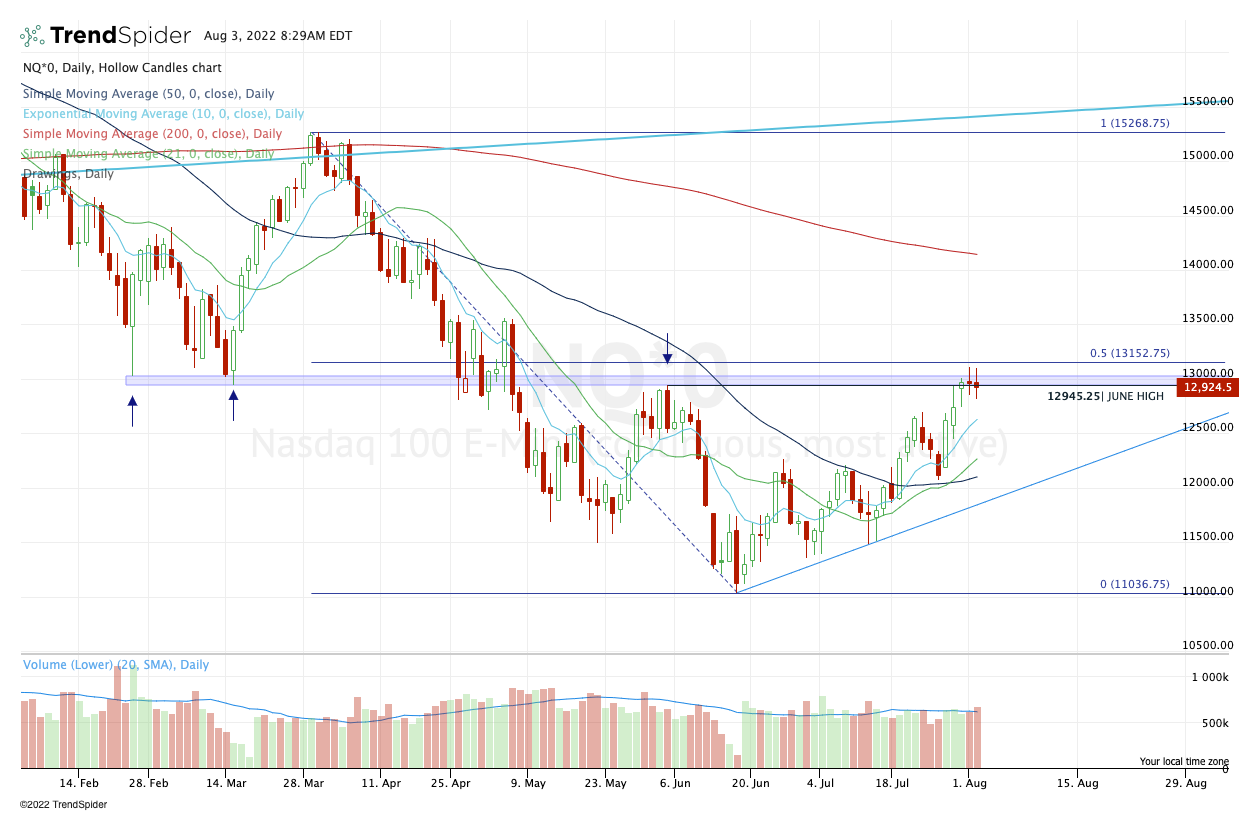
After FAANG rallied on mostly earnings misses, the question becomes, will the market be as forgiving with other tech stocks?
If yes, the NQ probably clears short-term resistance in the 13,100 area and pushes higher. If not, I want to see how it responds to the 12,650 to 12,680 zone. This zone is prior resistance and where bulls find the 10-day — which should be good for at least a bounce.
Nasdaq — QQQ

For the QQQ, that buy-the-dip zone is ~$307.
Go-To Watchlist — Individual Stocks
*Feel free to build your own trades off these relative strength leaders*
- Numbered are the ones I’m watching most closely.
- Bold are the trades with recent updates.
- Italics show means the trade is closed.
Trade Sheets: Now have 2-3 live trades, all with breakeven or better stop-losses. Great stress-free position to be in as we try to squeeze a bit more of upside out of this move.
- MCK — We have hit two trim zones so far on MCK. Feel free to cash the last ⅓ of the position as you see fit.
- Moving stop-loss up to $325 and given the consolidation, I am thinking of holding my last ⅓ for a push to $348 to $350.
- PEP — We got out Target No. 2 at $177. Either all out now or down to ⅓ of a position if playing for a breakout. Stop at $172 (above B/E).
- UUP — $28.60 to $28.80 is ideal first trim zone, but bulls can trim ¼ at $28.50-ish if they’d like, as the UUP runs into the 10-day ema.
- CHNG — volatile session on Monday, but held where it needed to. In fact, that spike down gave us a level to measure against. I’m using a stop-loss in the $23.20 to $23.35 area.
- Looking for $24.50 to $24.70 for first small trim, (i.e. ¼ to ⅕ position trim). More aggressive traders can look for $25+ for first trim
Relative strength leaders (List is cleaned up and shorter!) →
- O
- CNC
- HRB
- ENPH — kickstarted the rally in Solar
- TAN
- FSLR
- MSTR
- LNG
- PWR
- CHNG
- COST — trade is live
- PEP — trade is live
- BA
- UNH
- XLE
- MCK — trade is live
Economic Calendar

As we all know, there’s no crystal ball when it comes to trading stocks, options, or futures. But the Market Imbalance Meter may be as close as it comes. Knowing how the “Big Money” is placing its bets can give our trading room a big wave to ride — or a warning sign to stay out of the water. Come check it out now, risk-free for 30 days.
Comments are closed