The S&P and Nasdaq have very clear levels after the last two days.
Our View
No one knows for sure what the S&P will do next, but with the September Quad Witch on Friday, we are assured to see volatility will pick up. I don’t think there is a hell of a lot of stuff we have not covered that most already know so we are going to keep this short and sweet: If the ES closes poorly today, I think Friday could get bad.
I found this interesting if nothing else for a talking point:
The trading floors — aka the School of Hard Knocks — taught me one thing about this game and it’s pretty simple: You either roll with the punches or you’re knocked out. Simple as that.
Our Lean
The ES did a number on the shorts going into the final 20 minutes. Usually, when they pump up the futures on the close, it usually follows through on the upside for at least part of the day.
Just because the futures rallied yesterday does not mean anyone covered, but if the ES starts trading above 3986 we could see an upside stop run.
Our lean is to sell the rallies with tight stops. I don’t think this downside crap is over but…who knows! Quad Witch can bring out a lot of crazy action.
A Note From the Almanac
We have some great seasonality notes from the Trader’s Almanac for the September quad-witch expo.
“The NASDAQ is down 14 of last 23 with an average loss of -0.25%. September’s option expiration week is up 57.5% of the time for S&P 500 since 1982…Friday had been firm with all three indices advancing every year 2004 to 2011, but S&P 500 has been down nine of the last ten since.”
However, it’s next week that could be the problem:
“The week after September options expiration week has a dreadful history of declines most notably since 1990. The week after September quarterly options expiration week has been a nearly constant source of pain with only a few meaningful exceptions over the past 32 years. Substantial and across-the-board gains have occurred just four times: 1998, 2001, 2010, and 2016 while many more weeks were hit with sizable losses.
Full stats are the sea of red in the tables here. Average losses since 1990 are even worse; DJIA –0.98%, S&P 500 –0.89%, NASDAQ –0.85%. End-of-Q3 portfolio restructuring is the most likely explanation for this trend as managers trim summer holdings and position for the fourth quarter.”

Daily Recap

The ESZ traded up to 3979.50 on Globex and opened Wednesday’s regular session at 3962.50 on the 9:30 ET futures open.
The chart above highlights the moves, which were volatile and allowed from two-way trading — but it wasn’t easy. Plenty of 20 to 40-point swings in both directions and a feeling that the quad-witch choppiness is here.
At 3:15 the ES traded down to a new low at 3931.25, bounced back up to the 3942.50 level, and sold off down to 3929 as the early imbalance was showing $800 million for sale. The ESZ traded 3950.25 as the 3:50 cash imbalance showed $385 million to sell, shot up to the vwap at 3962.75, and traded 3964 on the 4:00 cash close. After 4:00, the ES traded up to 3975.25 and settled at 3973.75, up 15.25 points or 0.4%.
In the end, both the ES and NQ closed higher. During the session I posted several times that the ES ‘traded short’ and after the future made its 3981.75 high I put out an intraday update for premium subs that said I thought that should be good resistance. In terms of the ES’s overall tone, it was firm(ish), but whippy. In terms of the ES’s overall trade volume was high at 2.47 million contracts, but below Wednesday’s 3.15 million.
- Daily Range: 52.25
- High: 3981.25
- Low: 3929
Technical Edge
- NYSE Breadth: 52% Upside Volume
- NASDAQ Breadth: 63% Upside Volume
- VIX: ~$26.25
Game Plan: Bonds, Dollar S&P, Nasdaq
I want to remind everyone that, generally speaking, I am not a bearish person. I do not like to overthink the macro backdrop and while I’m aware of the negatives, I’m also aware of reality. Which is that since 1950, the S&P 500 has risen more than 80% of the time on an annual basis.
That said, being bearish for most of this year has simply been following the price action and the trend. On Wednesday, we saw the worst trading day since June 2020 as the S&P 500 fell 4.3%.
Yesterday’s mild rebound of 0.35% did not do much to reassure the bulls. If we rotate above Thursday’s high, it could indeed trigger more buy-stops and push the indices higher. My “gut” feeling says to be on the lookout for a rotation lower, though.
S&P 500 — ES
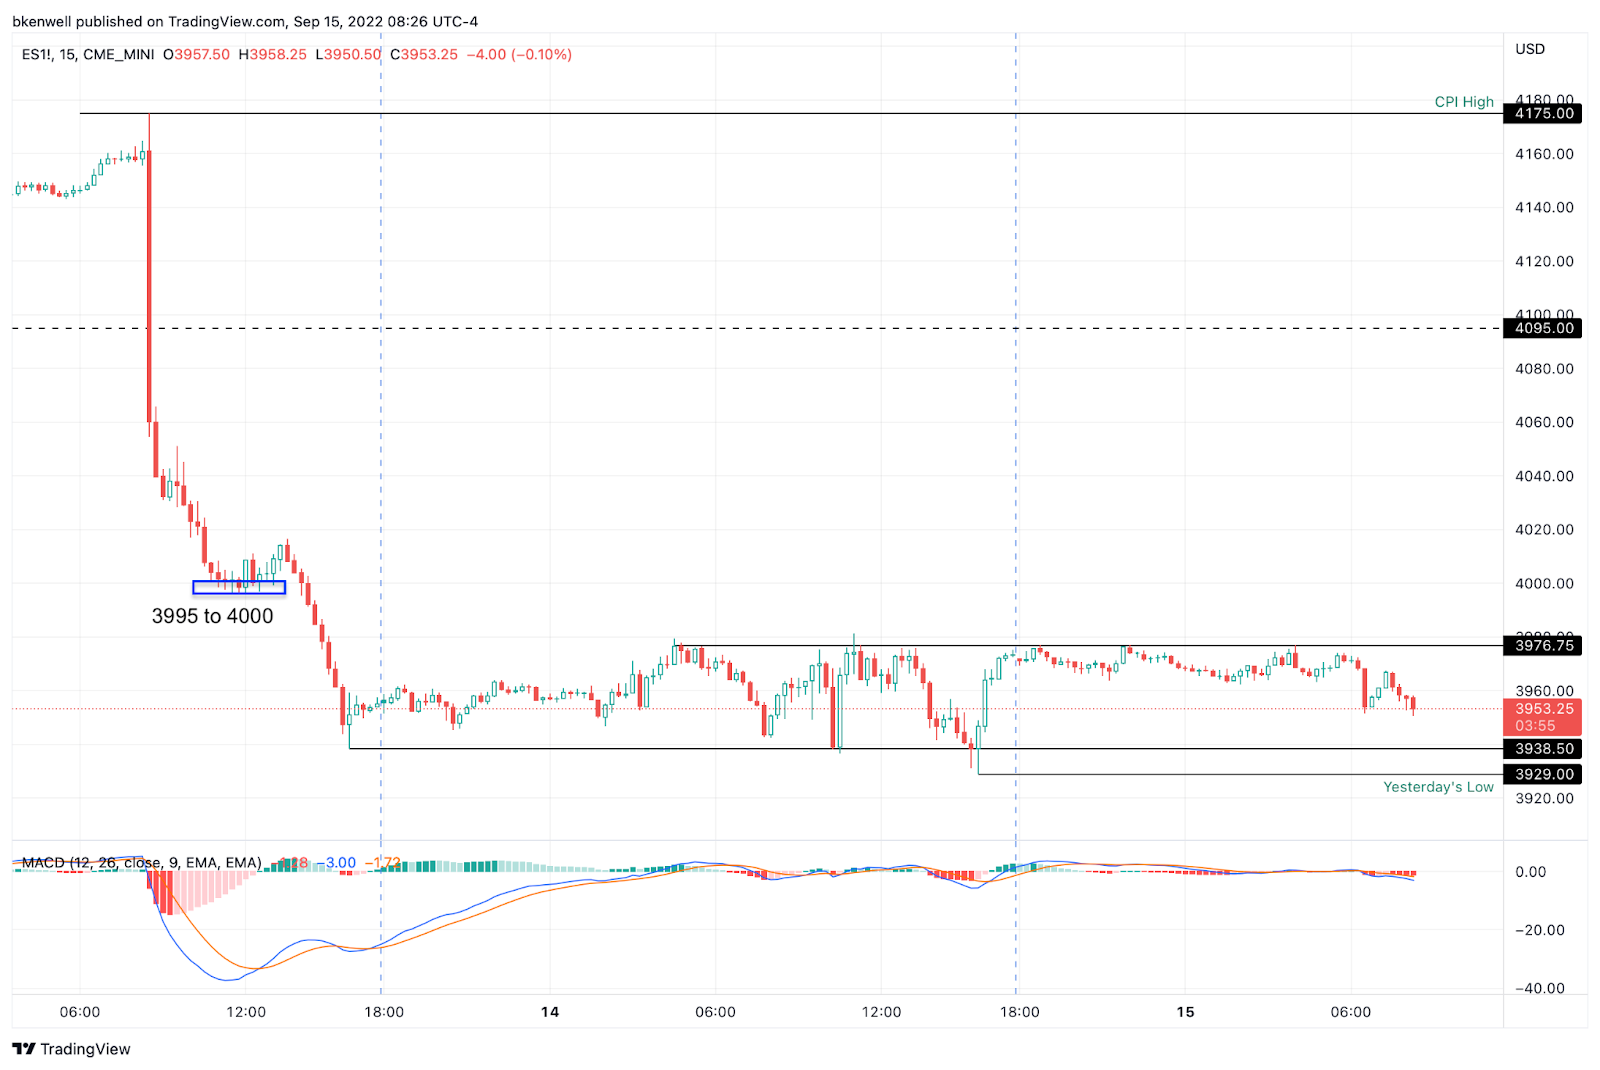
I’m doing things a little differently this morning and just looking at the 15-minute chart for S&P futures of the last two days.
The levels are clear-cut: 3975 to 3980 has been resistance, while support has been around 3935.
If we clear resistance, 3995 to 4000 is in play, which was post-CPI support for several hours on Wednesday. If we break support, yesterday’s low of 3929 is in play, followed by 3900, then 3883 to 3886 (the last weeks’ worth of lows).
SPY

In similar fashion, here’s the 30-min chart for the SPY.
$395.50 to $396 has been resistance, while $392-ish has been support.
A break of the latter puts $389-ish in play. A push above resistance puts $397.50 to $398 in play. Then $400.
For now, those are our guideposts.
Nasdaq — NQ

As for the Nasdaq, the levels are pretty clear-cut too.
12,080 is the two-day low. A break of this level and failure to reclaim it opens up the sell-steps and a run lower.
On the upside, 12,250 to 12,260 has been resistance. Above it and we could see a buy-stop push higher.
TAN — Solar Stocks

This market has been so tough lately, but TAN is trading like there is nothing wrong at all.
After a breakout over downtrend resistance (on the weekly chart), we got a bull flag reset to the 10-week ema. Now trying to rotate over last week’s high of $88.81, bulls are looking to drive this one higher.
If they can, $91 could be in play, followed by $97 to $100.
We don’t have to fire away at this one with all the volatility in the market, but if the market turns, it’s best to know where the relative strength is at.
Go-To Watchlist — Individual Stocks
*Feel free to build your own trades off these relative strength leaders*
- Numbered are the ones I’m watching most closely.
- Bold are the trades with recent updates.
- Italics show means the trade is closed.
Notes:
So I want to talk about tiers for a second. Because look, we just got stopped on TMUS and CHRW. However, it came after we hit our first upside target. That lets us put some money in the bank and raise our stops to B/E. We obviously risk a gap-down below our stops, but generally speaking, this puts us in a “risk-free” position.
Tiering is not for everyone, I get it. But in this tape you can see how it lets us stick with the winners — UUP and CHNG for instance — while essentially putting some money in our pocket and taking some risk off the table (by raising our stops).
- UUP — Down to ¼ position as we hold for potentially higher prices. Raise stops to $28.40 to $28.50. Look for $30 on the last piece.
- CHNG — Consider taking the last piece off at $25.75 to $26 or simply hold against a B/E or better stop and ride the trend higher. #Kudos
- OXY — Opening push on Buffett upping his stake, investors can trim as we will be near B/E on the position or they can ride against a $63.50 to $63.75 stop-loss. Three strong lows to measure against last week between $64 and $64.40.
Relative strength leaders →
SOLAR remains such an area of strength.
Top:
- TAN
- ENPH
- FSLR
- LNG — never got my $150 retest & Now an absolute monster.
- CAH
- F
- XLU
- XLE
- OXY
- BMRN
- PWR
- CHNG
- CELH
- COST
- UNH
Economic Calendar

Comments are closed