The levels are clear as day. It’s just a question of who will take control.
Last night I sent a video update on the S&P 500, taking a longer-term, zoomed-out view. If you haven’t seen it, that video can be viewed here (and apologies for my snoring dog in the background! Sheesh!)
Our View
Looking at your live P&L when you’re trading the ES and NQ is insane. One minute you’re up big and the next you’re down. You are trying to catch the larger move, but it goes ripping up 40 points in 10 minutes and all your profits evaporate. What do you do? You get out and then it drops 45 points down to a new low. You are firmly back in the black and out comes an imbalance of $2.2 billion to buy and the ES trades up to 3928.50 and you think you’re screwed again.
Does this sound familiar?
Well, it should — it was yesterday’s tape, after all — and all that in just 45 minutes. It’s possible to succeed in this environment, but anyone who tells you that it’s easy is full of it. It’s a lot of work and very draining.
It’s funny, most of us hate this kinda stuff, but we still go diving into it. I told the PitBull you cannot sit there all day — the action is simply too choppy. Tell the guy that executes your order to text you if the futures move 30 points in either direction. We both know the algos own the markets and we know that if you enter a position after the 200-point drops, you’re probably going to get run over.
All of the above is why I think sitting and looking at the screen all day hurts you more than helps — it burns through your mental capital.
You have a downside objective and you have a stop in. As hard as this is for me… you’re supposed to leave it be! Today is the Sept Quad Witch and it’s going to be a volatile day. Use stops or don’t play at all.
And it’s already off to a bad start after FedEx CEO Raj Subramaniam answered the question of “[Are we] going into a worldwide recession?” with: “I think so. But you know, these numbers, they don’t portend very well.”
The company reported terrible preliminary numbers.
Our Lean
The ES took out 3900 last night. Unless we have all had the wool pulled over our heads, these markets look lower. PitBull said 3800 first. Will the ES go straight down? I don’t think so.
There should be a 30- or 40-handle pop to sell, but hopefully, that comes from the 3870s, allowing us to sell near 3900. See the levels in the Technical section below.
Be smart: Don’t buy the rip and don’t sell the dips. Selling into the hole and buying late into the rallies is going to get you killed in this kind of tape.
Daily Recap

As highlighted yesterday, 3975-ish has been resistance and the ES opened near 3945 on Thursday. It down-ticked a few points, then rallied 37 points to the session high of 3977.50. From there…well, you can see the moves above.
We had a choppy, up-and-down session, full of 25 to 35+ point moves. At 3:23, the ES traded down to a new low at 3809.50 and then popped up to 3915.75 after (from the chat room) — IMPRO(14:13:42) HLCamp: “Second Program Selling Level from Algo 9 = 3908.00”
Then sold off down to a new low of 3905 at 3:30. From there, the ES rallied back up to 3921 at 3:46 and traded 3916 as the 3:50 cash imbalance showed $2.2 billion to buy, climbed to 11 to 3927.25 and traded 3918.75 on the 4:00 cash close. After 4:00 the ES traded up to 3928.50 and out of nowhere the ES dropped 23 points down to 3905.50 and settled at 3910 on the 5:00 futures close, down 63.75 points or -1.60% on the day.
In the end, it was another day of “Rock’em, Sock’em, Robots” and despite not taking out 3900, the futures still closed down on the day. In terms of the ES’s overall tone, the ES was weak, but 3900 did hold even as the two-day low failed. In terms of the ES’s overall trade, volume was steady but not big at 2.4 million contracts traded — and remember, that includes Globex and the S&P roll volume.
- Daily Range: 72.50
- High: 3977.50
- Low: 3905
Technical Edge
- NYSE Breadth: 35% Upside Volume
- NASDAQ Breadth: 40% Upside Volume
- VIX: ~$27.30
Game Plan: Bonds, Dollar S&P, Nasdaq
In an environment that is becoming increasingly choppy and difficult, we need to dial back and make things simple…Simple, SIMPLE, SIMPLE!
When markets speed up, we need to slow down. That’s the only way to combat what we’re seeing right now. Case in point?
On Thursday, we said 3975 to 3080 was resistance. Where was the high? 3977.50. Then floor support gave out. For the SPY, it was “$395.50 to $396 has been resistance.” The high? $395.96.
So after a big move and sideways action, you’ve got to find the ranges and simplify things: Are we above support or below it? Are we above resistance or below it?
Sometimes it’s as simple as a fucking line drawn across your chart. Are we above that line or below it?
Simplicity is your friend.
S&P 500 — ES

I’m going to zoom in, then zoom out.
This is a chart capturing Tuesday’s CPI low at 3938.50, Wednesday’s range, and Thursday’s range. Notice how we ran up and tagged resistance, faded hard, and lost the two-day low (which was 3929).
Then we regained it and bulls had a glimmer of hope. But notice the final 60 to 90 minutes. The ES lost 3938.50 support, then the prior day’s low of 3929. After bottoming at 3905 and making a 20-point rebound (and with a $2.2 MOC buy), it could not regain the prior day’s low.
I like to call this “deliberate price action.” The ES deliberately did not regain the prior day’s low when it had every opportunity to do so near the close. That sets a tone and it’s not a very good one.
ES — Now What?
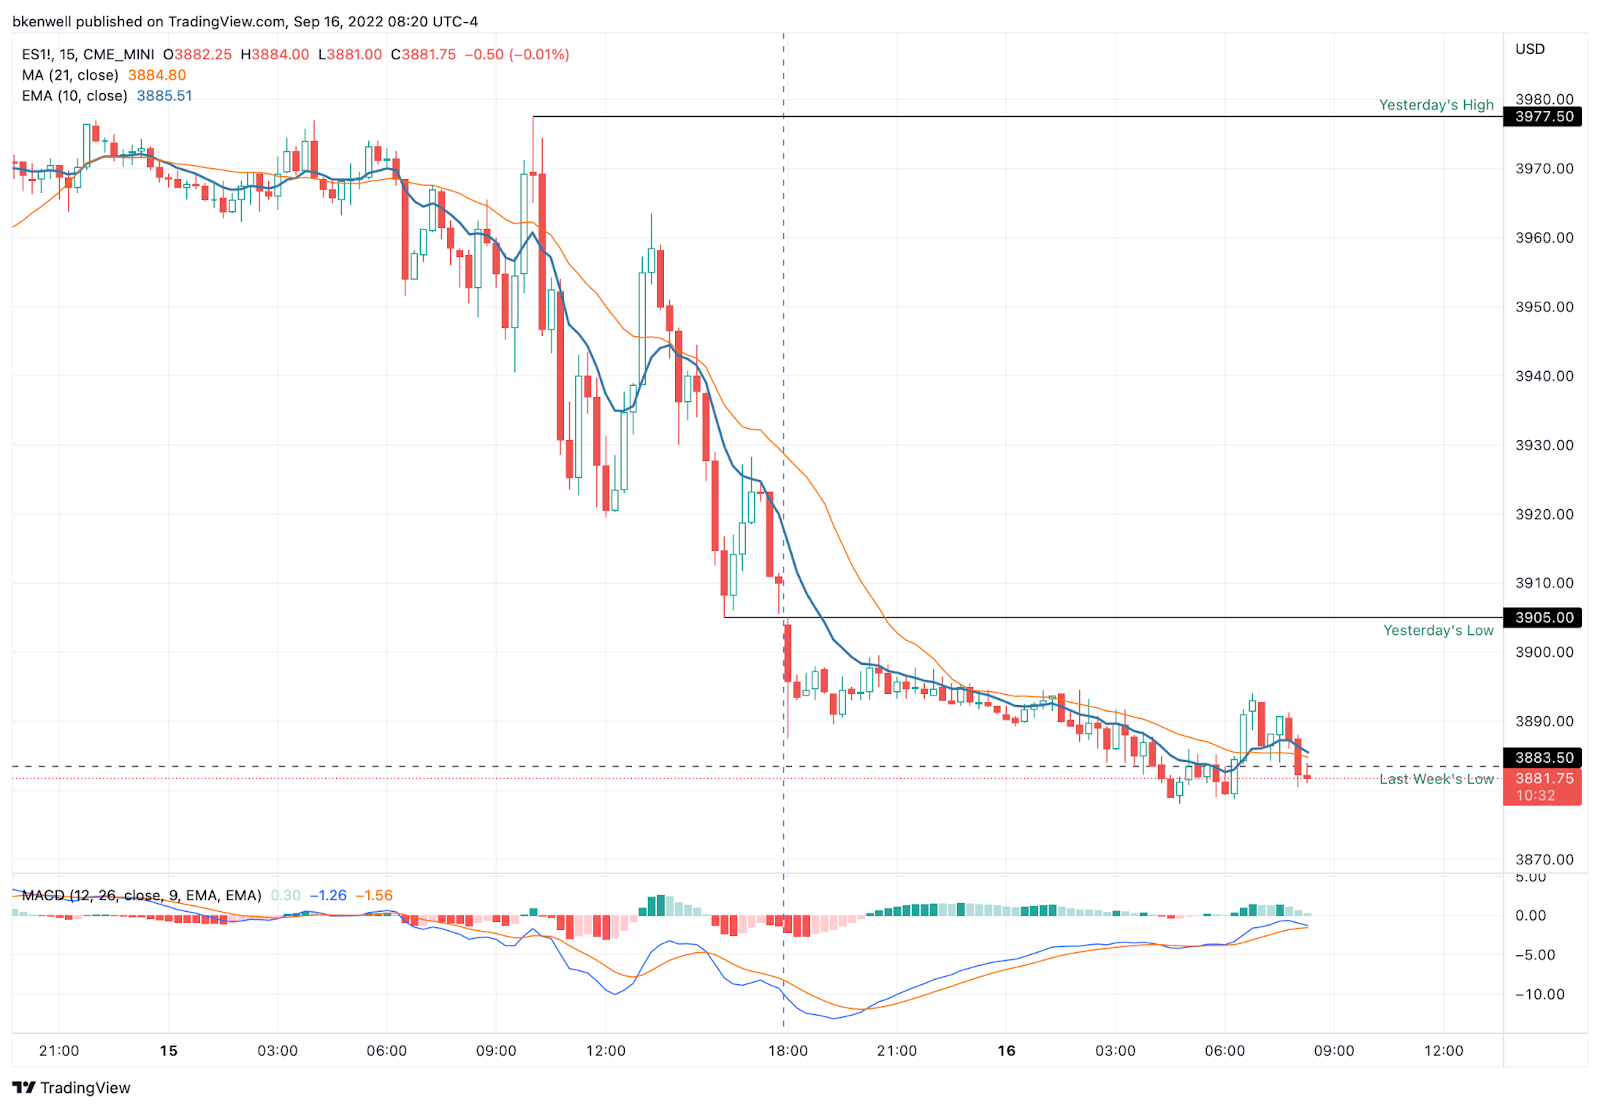
This is a 15-minute chart of yesterday’s session and the overnight Globex session in the ES.
We are chopping around last week’s low of 3883.50. With a gap-down, I could see a scenario where we fill the gap up to 3900 to 3905 early in the session and fade again.
That will be the top setup that I’m looking for this morning, is selling the early rally.
(If we clear 3905, a push up to the 3920 to 3925 area could be in the cards, which was support in the morning and resistance late near the close).
ES — Daily

As you can see on the daily chart, the ES is leaning on the last two weeks’ worth of lows in the Globex session. If it gives way, I don’t really know where support comes in next. We’re already below the monthly low and the quarterly low is quite a bit lower.
Does it open the door down to 3785 to 3800? It could. That’s only 80 to 100 points lower from here. The bigger picture zone to watch is 3750, IMO.
SPY

The SPX/ES has a lot of charts above and I’ll avoid doing that for the SPY and try to keep it a little bit simpler.
As of about 8:15 ET, the SPY is trading $384 to $385 in the pre-market. In other words, a notable gap-down. If we rallied $4 off the open, it would be impressive actually. But the problem is $388.50 to $390. That’s not just yesterday’s low, but the last few weeks’ worth of lows.
A gap-fill back to this area has me looking to sell — and why not?
The bearish dominos have been piling up and this is a great Risk/Reward zone if we get there. We have a clear line in the sand at $388.50 to $390. If we regain this area, the bulls have something to work with.
But selling this gap-fill (again, if we get it) lets us know right away if we’re right or if we’re wrong because we’re either going to reclaim and build higher (AKA, we’re wrong) or we’re going to fade from this zone, letting us get ahead in the position quickly and manage from there.
Nasdaq — NQ

One scenario developing for the NQ is an “ABC” correction back down to the low 11,000s.
That’s negated — or at the very least, delayed — if it can regain the 11,930 to 12,000 area.
QQQ

Lastly, I’ll end with the QQQ. Set to gap-down this morning, the QQQ will fill a gap it left behind in July at $287.56.
If we get an early morning rebound, keep an eye on the gap fill from today’s lower open in the $289.50 to $291 area. That’s yesterday’s low and last week’s low, respectively.
Like the SPY, I want to see if this area is resistance or if it’s reclaimed. The bulls do not have the benefit of the doubt and are very much in a “prove it” position. They prove it by reclaiming an area that has become support this summer.
To lose it — or to be rejected by it — says bears are in control. That could put $283 on the table.
Go-To Watchlist — Individual Stocks
*Feel free to build your own trades off these relative strength leaders*
- Numbered are the ones I’m watching most closely.
- Bold are the trades with recent updates.
- Italics show means the trade is closed.
Notes:
So I want to talk about tiers for a second. Because look, we just got stopped on TMUS and CHRW. However, it came after we hit our first upside target. That lets us put some money in the bank and raise our stops to B/E. We obviously risk a gap-down below our stops, but generally speaking, this puts us in a “risk-free” position.
Tiering is not for everyone, I get it. But in this tape you can see how it lets us stick with the winners — UUP and CHNG for instance — while essentially putting some money in our pocket and taking some risk off the table (by raising our stops).
- UUP — Down to ¼ position as we hold for potentially higher prices. Raise stops to $28.40 to $28.50. Look for $30 on the last piece.
- CHNG — Consider taking the last piece off at $25.75 to $26 or simply hold against a B/E or better stop and ride the trend higher. #Kudos
- OXY — Opening push on Buffett upping his stake, investors can trim as we will be near B/E on the position or they can ride against a $63.50 to $63.75 stop-loss. Three strong lows to measure against last week between $64 and $64.40.
Relative strength leaders →
SOLAR remains such an area of strength.
Top:
- TAN
- ENPH
- FSLR
- LNG — never got my $150 retest & Now an absolute monster.
- CAH
- F
- XLU
- XLE
- OXY
- BMRN
- PWR
- CHNG
- CELH
- COST
- UNH
Economic Calendar

Comments are closed