Stocks look tired, but the trend remains bullish.
Follow @MrTopStep and @BretKenwell on Twitter and please share if you find our work valuable.
Our View
I know things are very unsettling and more than ever I firmly believe that “No one knows for sure what the S&P is going to do next.” I remember the pain inflicted on people during the credit crisis and while I can’t quantify it, my gut feeling is that 2023 is going to see some very big ups and downs — and I think we have already seen part of the “up.”
I always hold out hope that things are going to improve, but I think there is just too much time in the year for a sustained rally that will hold. Many big names have already put together massive moves. TSLA is up 63% this year and has doubled from the January low. NVDA is up 52% YTD and has rallied 60% off the January low. These are $500+ billion market cap companies, not some piddly little penny stocks.
I remember being at my S&P desk and watching the volume go higher and higher and higher as the S&P fell during the credit crisis. Today a big volume day in the ES is 2.5 million contracts; back then high volume in the ES was 3 million, but as the markets fell the ES volume started to hit new daily records. I remember I was writing it down on a trading card after it got above 4 million.
We could see it at the desk too, the pit was still open and orders were flying, but over the next few days it jumped to 4.9 million and the next day it was 5.5 million and then over the next 5 sessions it rose from 4.1 million to 6.5 million to an all-time record volume of 6.6 million ES traded in one day. Globex volume ranged from 1 million to over 1.8 million on the record volume days.
Why am I saying this? The 6.6 million contract day in the ES marked the lows of the credit crisis and the S&P rallied over 600% from its lows. I doubt the ES will ever see volume that high, but the point is when the ES dumps and we start seeing over 3.5 million to 4.5 million a day, I would say the low is getting close. It’s called capitulation and I don’t believe we have seen it yet, but I’ll be on the lookout for when it does.
Our Lean
As the saying goes, these are not our father’s markets or charts, nor will they ever be. The markets are evolving and soon we will be asking our friendly neighborhood Al to do the buying and selling.
Our lean is to continue to respect the trading range. Selling under 4110 doesn’t work and buying above 4185 doesn’t either. The last time the ES did this was with the 3800 to 3920 range that eventually resolved higher. The chart looked like a big back-and-fill pattern and does now too.
Levels: 4175 to 4185 remain key on the upside. Above that puts ~4210 in play, then possibly much higher. On the downside, my levels are 4150, then 4125-4130.
MiM and Daily Recap

The ES sold off down to 4151.25 on Globex and opened Wednesday’s regular session at 4153.75. After the open the ES traded down to 4149.75, rallied up to 4166.50 at 9:45, and then dropped down to 4123.5 at 11:45. After the low, the ES rallied up to the vwap at 4148.25 at 1:07 and then sold off down to 4130.50 at 2:02. We suspected after last week’s Fed-day grinder it would be choppy.
The ES traded back up to ~4144 at 2:18 — a lower high — and then down to a new low of the day at 4121.25 at 3:20. The ES pulled back down to the 4125.25 level at 3:30 and then rallied up to 4134 at 3:45. The ES traded 4130.75 as the 3:50 cash imbalance showed about $1 billion to sell and traded 4130.50 on the 4:00 cash close. After 4:00, it trade down to 4126.50 and then up to 4133.50 settled at 4132.50, down 43.25 points or -1.04% on the day.
- /NQ closed at 12,545 — down 231.5 points
- /ZB (bonds) closed 128.11 — down 0.02
- Crude oil closed at $78.47 — up $1.33
- Gold closed at $1890.70 — up $5.90
- Dollar index closed at $103.468 — up 0.13
Technical Edge
- NYSE Breadth: 33% Upside Volume
- Advance/Decline: 32% Advance
- VIX: ~$19.25
Is the S&P climbing a wall of worry? Seemingly nothing the Fed says at this point is enough to knock the index down. That’s as the bond market and Fed Funds Futures continue to price in a rate cut by year-end.
The CPI report next week should shed some light on the Fed’s next action. Until then, the index continues to grind.
We have a gap-up today, but I am just a tad skeptical, as many tech names looked quite tired yesterday (NVDA, MSFT, GOOGL, etc.) Gap-ups above the highs and failure to hold them creates a bit of a “risk-off” trade for active traders.
S&P 500 — ES

We got a strong response off the 4150 level right after the 9:30 open, trading 4149.75 then bouncing almost 20 handles. Then the S&P settled into a day of two-way action where traders had to be in and out of positions to make it worthwhile.
As for today, look at the way the ES continues to pennant under the 4175-4180 area. A clean breakout over this area opens the door up to 4208. A weekly-up close today over this level potentially opens the door up to 4300+
Wednesday was an “inside day” so a break of the range could trigger a rotation.
Reversal Trade? Coming into the session hot, I don’t know if we’ll see yesterday’s low of 4121. If we do, look for that reversal trade. That’s where the ES breaks the low, tags the 10-day and reclaims the low.
SPY
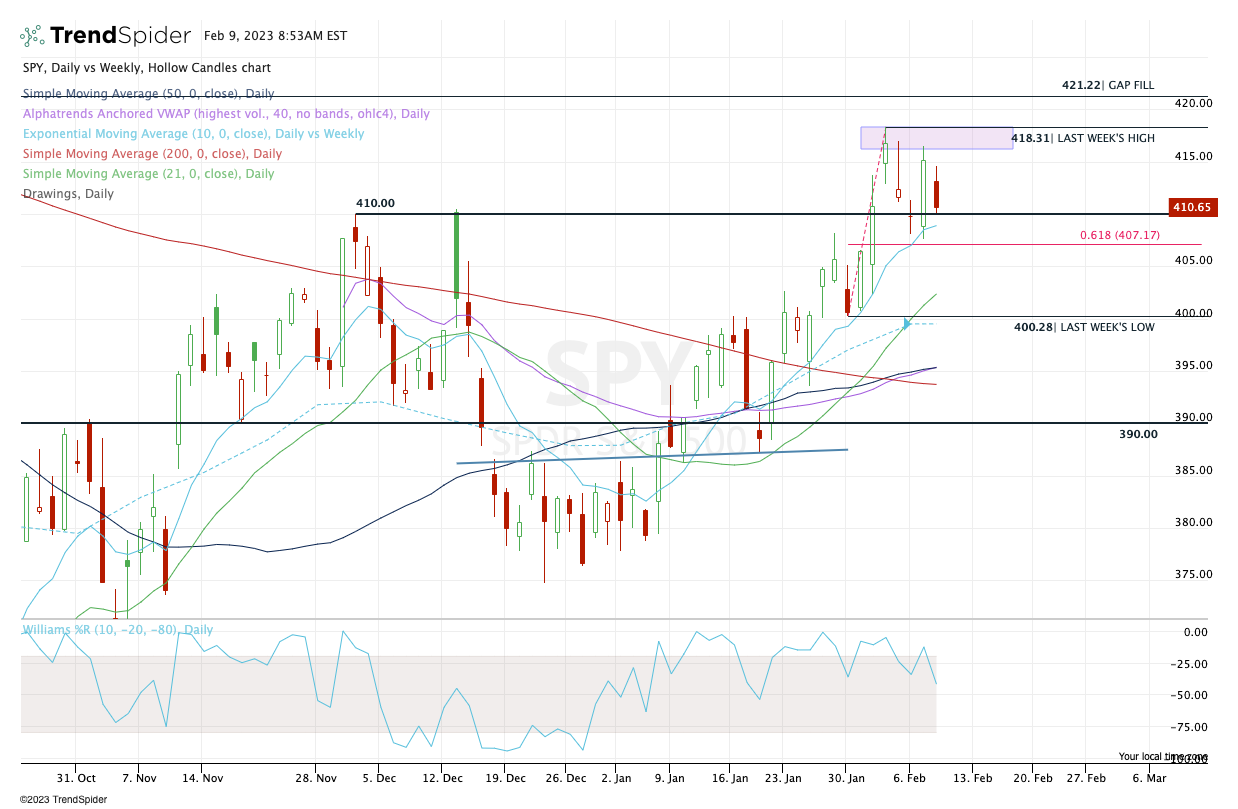
Daily-up over $414.50 would put the $416 to $418 resistance zone in play, with the weekly-up in play at $418.31. If we clear that, $421 is in the picture.
On the downside bulls, $410 and the 10-day are vital. Below and we have an air pocket to the downside and they could run the stops.
QQQ

Trading near yesterday’s $309.50 high in the pre-market now, keep a close eye on this level. If we have strong breadth and the market wants to run, it will clear this level and push into the $311 area, putting a weekly-up in play at $313.68.
On a low-breadth push, we could see a “look above and fail” over $309.50 — meaning the move above yesterday’s high reverses lower.
Open Positions
- Bold are the trades with recent updates.
- Italics show means the trade is closed.
- Any positions that get down to ¼ or less (AKA runners) are removed from the list below and left up to you to manage. My only suggestion would be B/E or better stops.)
- None at this time!
Go-To Watchlist
*Feel free to build your own trades off these relative strength leaders*
Relative strength leaders →
- AQUA
- AEHR
- GE
- NVDA, TSLA, SHOP
- SBUX
- MELI
- NFLX
- WYNN, LVS
- AXP
- BA & Airlines — AAL, DAL, UAL
- TJX, ULTA, NKE
- CAT
- HCCI
- XLE — XOM, CVX, COP, BP, EOG, PXD — (Weekly Charts)
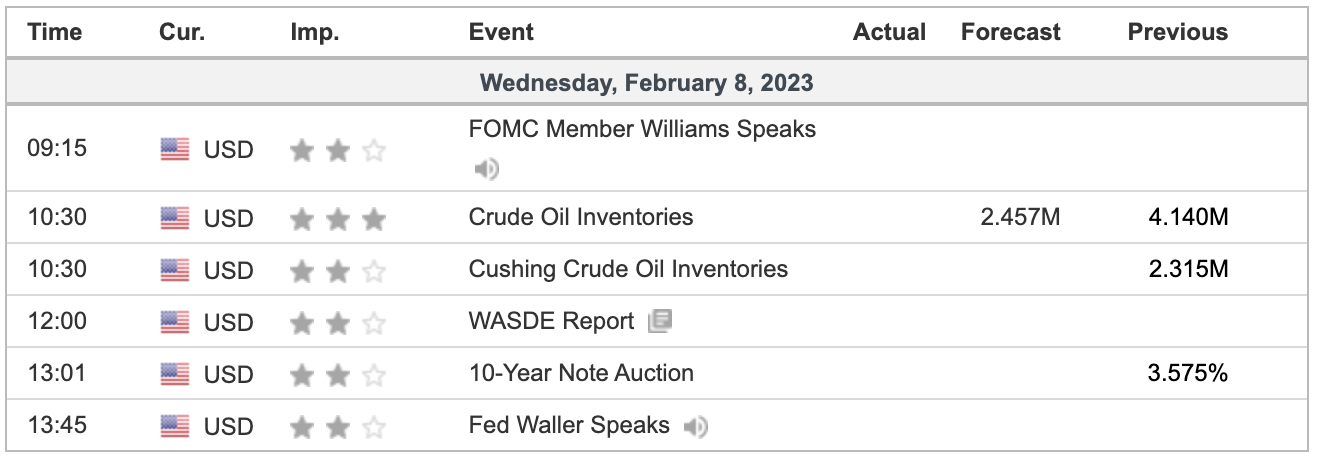
Economic Calendar
Comments are closed