BTD setup in Tesla?
Follow @MrTopStep and @BretKenwell on Twitter and please share if you find our work valuable.
Our View
You would have thought yesterday was an FOMC day or CPI day with the way the market traded following the 12:40 comments from Jerome Powell.
The market initially spiked then puked 76 handles before reversing and taking out the high. Everyone’s going to be talking about Powell and the Fed this morning, but there is something else I want to talk about. It’s Putin’s war in Ukraine.
Despite what we read in the US, Ukraine is getting its ass kicked. They say soldiers on the frontline have a 4-hour life expectancy. I have always said that 1) Putin was not going to sit by and watch his military get steam-rolled and 2) that something big is going to happen in 2023.
Well, it’s already happening. Feb 24 is the one-year anniversary of the invasion and there is speculation that things could get much worse. The new Russian buildup has already commenced as it readies for another push. Not only is Ukraine outnumbered, but they are also outgunned. Moscow is intensifying its assault and the loss of life is only going to increase.
Ukraine says it has 250,000 boots on the ground, but I think the real number is around 200,000. On the Russian side, they say 280,000 on the ground with another 150,000 to 200,000 being recruited or on the way.
The other problem with Putin? His access to nuclear weapons. It doesn’t mean he’ll use them, but you can’t be 100% sure that he won’t.
So what does all of this have to do with the stock market? While US stocks can continue to climb, I don’t think it’s going to go flying back to new highs right now. There is just too much risk floating around — Russia being one of those risks — and sadly, as I said earlier, the next six months in Ukraine are going to see a lot of death and carnage.
Our Lean
Yesterday was a tough day in the market, with those wide trading ranges. Really, you have some traders who made an absolute killing and others who were crushed. Many ended up being chopped one way, then chopped another.
We did get some nice feedback yesterday about our 4100 “buy zone” call, especially the way it regained the prior day’s low — so thank you to those who reached out about that.
Last Friday, the ES traded 4194 on the high and yesterday it hit 4188. That six-point zone appears to be firming up as a potential resistance point. You could also say the ES has been back-and-filling at the 4100 level for the last week.
Based on yesterday’s price action I think we could see higher prices, but I can’t rule out selling a higher open or the early rallies.
MiM and Daily Recap

The ES sold off down to 4110.25 on Globex and traded 4111 on the regular session open. From there, the ES sold off down to 4106. There have been lots of buy imbalances but it seems like there is someone constantly whacking the bids. After the low, the ES rallied up to 4129.75 at 11:30 and slowly pulled back down 4120 just before the Powell headlines started to hit and then rallied 34.5 points up to 4175 at 12:58, 79.5 points off the low of the day and 55 points off the Fed 4120 low in just a few minutes.
After the high, the ES pulled back down to 4098.25 at 1:35. The ES rallied up to 4179.50 as the 3:50 cash imbalance showed $1.7 billion to buy. On the 4:00 cash close the ES traded 4175 and after 4:00 the ES settled at 4166.25 on the 5:00 cash close, up 52.25 points or up 1.27% on the day.
In the end, it was choppy in the first part of the day, but after Powell’s comments, the markets shook off the selling and rallied. In terms of the ES’s overall tone, it was firm and held where it should have: 4100. In terms of the ES’s overall trade, volume was higher at 2.125 million contracts traded.
- /YM closed at 34,206 — up 272 points
- /NQ closed at 12,776 — up 261 points
- Crude oil closed at $77.14 — up $3.04
- Gold closed at $1884.80 — up $5.30
Technical Edge
- NYSE Breadth: 61% Upside Volume
- Advance/Decline: 62% Advance
- VIX: ~$19
ss
S&P 500 — ES

Clearly, 4175 remains significant to the ES, which is down about 20 handles an hour before the open.
If it can clear 4175, Danny’s 4188 to 4194 zone is in play, followed by last week’s high near 4208.
Bulls do not want to see 4175 cement itself as resistance and to give up yesterday’s gains. If it does, here are the downside levels we’re watching:
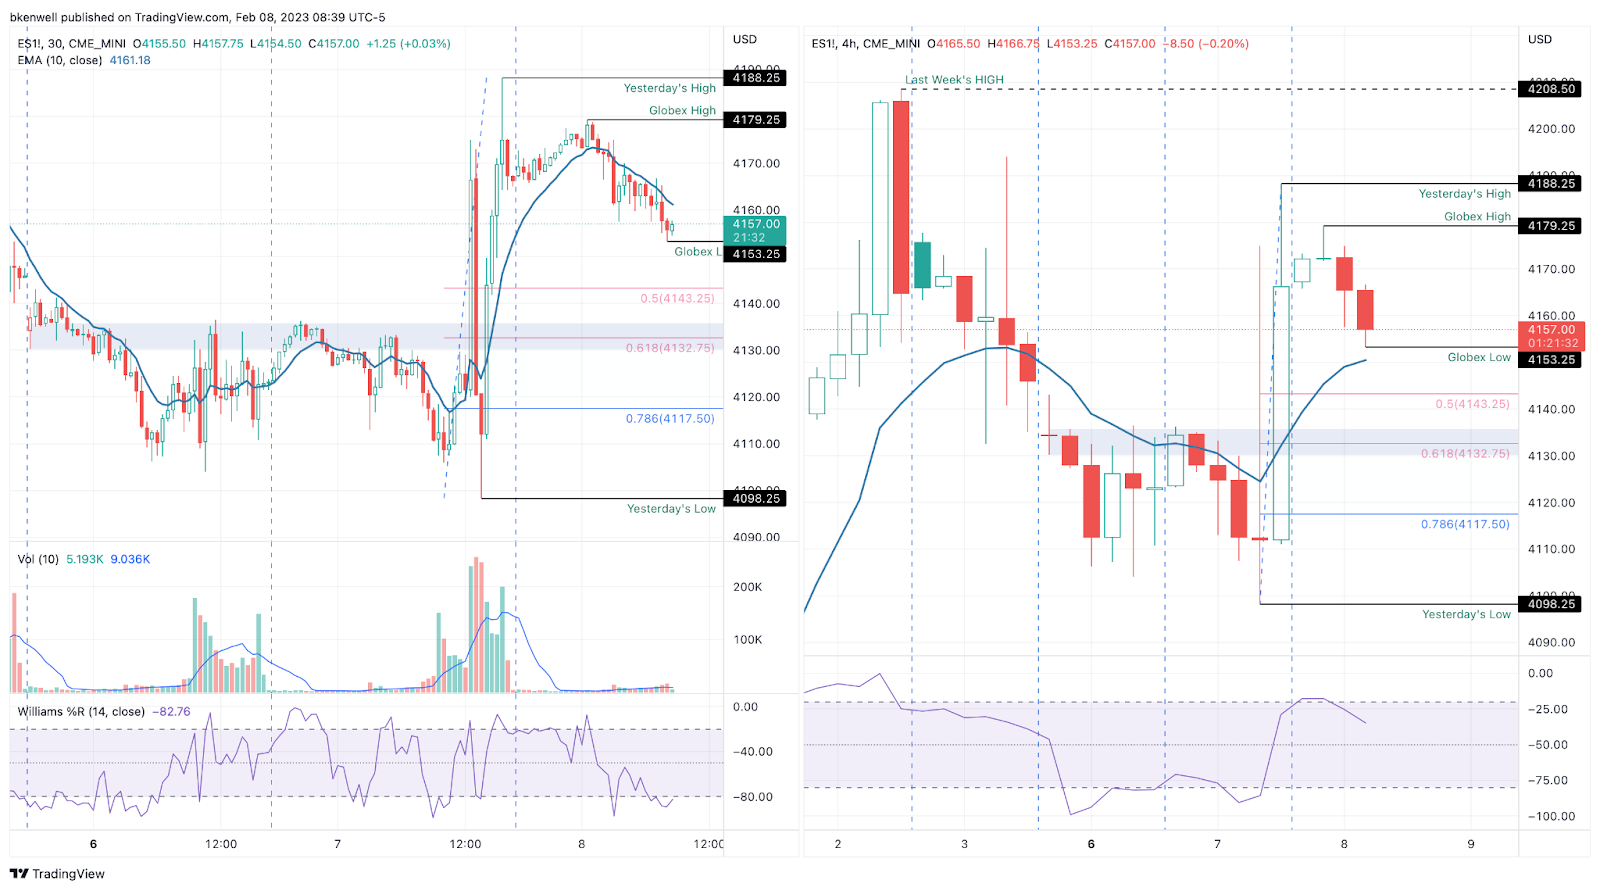
The first level I’m watching is the 10-ema on the 4-hour chart near 4150 (right). However, the bigger level that has my attention is 4130 to 4135 (left).
That was a prior resistance level before yesterday’s late-day rally and it’s the 61.8% retracement of Tuesday’s range.
SPY

At some point, they will stop buying the dips, but if it’s not today, look for bulls to step in on this opening dip.
Specifically, I am watching the 10-ema on the 30-min chart, and the 50% retracement + 10-ema on the 1-hour chart. This applies to both SPY and SPX.
TSLA

TSLA keeps bumping its head on $200, but failing to gain traction through. It’s looking a bit more tired, up in 12 of the last 13.
Let’s see if we can’t get a pullback to active support at the 10-day ema. I’d love to see that dip today and get some Feb. calls as a way to play a rebound while limiting our risk.
Open Positions
- Numbered are the trades that are open.
- Bold are the trades with recent updates.
- Italics show means the trade is closed.
(Any positions that get down to ¼ or less (AKA runners) are removed from the list below and left up to you to manage. My only suggestion would be B/E or better stops.)
From this latest round, that includes TLT, DE, FSLR and NKE.
- None at this time!
Go-To Watchlist
*Feel free to build your own trades off these relative strength leaders*
Relative strength leaders →
- AQUA
- AEHR
- GE
- NVDA, TSLA, SHOP
- SBUX
- MELI
- NFLX
- WYNN, LVS
- AXP
- BA & Airlines — AAL, DAL, UAL
- TJX, ULTA, NKE
- CAT
- HCCI
- XLE — XOM, CVX, COP, BP, EOG, PXD — (Weekly Charts)
Economic Calendar

Comments are closed