S&P Plummets 153 Points
Margin-call selling only added to the waves of selling.
Danny’s View
It was a rough day. I did well early and started losing late, but all and all I did very well. That said, the markets are in a state of flux.
The PitBull repeated what he’s been saying for several weeks. He said it’s like the “Nifty Fifty” and went on to say that global QE has reached $30 trillion and that someday we are going to wake up and we will see a real crash.
He also said “Did you see what happened to Cathie Wood’s fund? She is long all the hot names and she is getting killed.”
The fund is down 8.5% over the last 30 days, down ~11% over the last 3 months, and down 13.5% YTD. When ARKK gets a redemption, the mutual fund is forced to sell the ETFs to raise money and is essentially lowering the value of the fund.
She is just one example of the current “liquidation trade.” I am not going to make any excuses and I was right about a few things yesterday.
1. I told you my long NQ position in yesterday’s Opening Print and I said traders needed to fade the open.
2. I got out of my long NQ position before the open. I shorted the gap up in the NQ and then bought the early ES dip as we talked about. At first, it was a big rally off the dip, but from there, things went south as I continued to try and buy into the decline.
3. I made, I lost and ultimately, I ended up giving back just the day-trade profits and a few thousand more. So while I didn’t catch the short, I kept it tight with my stops and getting in and out of my trades. That kept a bulk of my profits alive. Yesterday was the kind of day that if you didn’t honor your stops, you got smoked.
Our Lean
Today Jeff Hirsch is going to come talk about the end-of-the-year seasonalities in the MrTopStep forum. I have a few questions for Jeff:
- Have you seen this type of price action at the beginning of December?
- Do you think people are trying to get long too early into the end-of-the-year cycles?
- When is the best time to start looking for a low to hold?
- The S&P 500 is down 4.9% from the highs — call it 5%. What do the probabilities say after a move like that, particularly at this time of the year?
- As a follow-up: Especially after it took so long to get to a 5% dip the first time and we had it in October, falling 5.8%.
Our lean is that after a big trouncing, the ES should recover a bit. People on Twitter were asking if ES 4900 is out of the question? I say it’s not.
The futures are almost 250 points off the contract high and based on the size of the moves, going back up 100 or 150 points over a few days are not out of the norm. I have held off on my YM and ES long calls, but after I hear what Jeff has to say I might start nibbling.
My feeling is that we bounce today but the question remains, how far will we go, and will the rally hold? If the ES gaps lower, then I may buy the open for a scalp.
Danny’s View: The Opening Print Recap
The ES rallied sharply on Globex Tuesday night into Wednesday morning, trading all the way up to 4622875, up 72 handles from Tuesday’s late-day low. It opened Wednesday’s regular session near 4620 and immediately sold off down to 4606.25.
After the low, the ES stutter-stepped back up to the 4619.50 level, pulled back down to the VWAP at 4610.50, and rallied up to 4630.50 at 10:02 as the Fed’s Jerome Powell started speaking.
The ES traded up to 4635.50 at 10:20, then the NQ started pulling back. The ES slowly pulled back down to the 4626 area, rallied up to the 4630 area, and then a Fed headline hit saying, “Risks Of Higher Inflation Have Moved Up” and the ES fell 15 points down to the VWAP at 4615.75 at 10:40.
The ES bounced around from there while making its way higher, and ultimately traded up to 4649.75 at 11:20. After another downtick, the ES made another new high at 4650.75 and then dropped down to 4626.50 going into 12:00.
Essentially, the ES pushed up through the Globex high at ~4629 and then bounced between that mark and yesterday’s high near 4644. Then the headlines started hitting the tape:
- The first reported case of the new covid-19 variant in California
- Dr Fauci says in a matter of 2 to 2.5 weeks, we will know more about transmissibility.
The ES was already moving down, but it accelerated lower from the 4597 area at 2:00 and really fell hard from there. From 11:30 to 4:00 pm, the ES did not register one green candle on the 30-minute chart.
That should give some perspective to the selling pressure, as it fell from a high of just over 4650 to a close of 4508.50, a decline of more than 140 handles.
The final 3:50 imbalance showed $3.6 billion for sale and the ES made new lows at 4505.50 at 3:59 and traded 4504.50 on the 4:00 cash close.
After 4:00 the ES continued its downward spiral, bottoming at 4497.75. The ES traded up to 4517.75, then dipped and settled at 4507.50 on the 5:00 futures close, down 78 points or 1.70% on the day, but down 143 points from the high.
In the End
In the end, it has been a big game of shake & bake. Get everyone revved up about the downside and the futures rally sharply. Then when everyone gets long into the rally, the ES and NQ sell-off.
Clearly, the algos love the increased volatility. Currently, the average three-day ES trading range is 68 points and yesterday’s range was 153 points.
In terms of the ES’s overall tone, it was firm all night and for the first part of the day, but the Fed and Omicron headlines weighed down the futures extremely hard. In terms of the ES’s overall trade, volume was HIGH at 2.6 million contracts traded, the second day in a row it has eclipsed 2.6 million contracts.
The last time we saw this much volume was back in March.
As we all know, there’s no crystal ball when it comes to trading stocks, options, or futures. But the Market Imbalance Meter may be as close as it comes. Knowing how the “Big Money” is placing its bets can give our trading room a big wave to ride — or a warning sign to stay out of the water. Come check it out now, risk-free for 30 days.
Technical Breakdown
NYSE Breadth: 81.8% downside volume (!)
NASDAQ Breadth: 70% downside volume
Trading is hard, especially with our emotions running high. One way to eliminate that impact is to have a Game Plan going into the day. That’s what we attempt to do here. With our levels, we’ve been able to “take the temperature” of the market without being so emotionally attached. In short, we are simply reacting to a series of expectations we have already outlined.
Notice how we’ve had “key levels” in the SPX/SPY/ES and the QQQ/NQ. They are full of “if, then” statements — very cold and honest assessments. Please give the indices a good read today.
This action has been very tricky, with a range of gap-ups and gap-downs. Thankfully, I think we were really prudent on Wednesday. Specifically, we said:
“Bulls will be feeling good at the open, but we have to remember it’s a game of offense and defense and at least for me, defense means not letting a winner turn into a loser. [in reference to the SPY] If we remain below Tuesday’s high of $464.03 — and thus the 10-day moving average — it can remain a two-way trade for now.”
I’m certainly not gloating. Luckily, our individual setups didn’t trigger thanks to the hearty gap-up. But it was a tough day to navigate nonetheless.
Wednesday was incredibly misleading because the breadth was so strong at the open and that carried on for several hours, with the NYSE putting in an 85% to 88% upside day throughout the morning.
The fact that it faded to an 81.8% downside day is highly concerning, particularly after the 89.4% downside day on Tuesday and the 90% downside day on Friday. That’s a lot of distribution in a short period of time.
I’m not sure what’s more concerning at this point: The three 80%-plus downside days in a four-session span or the fact that we flipped from 80%+ upside volume at 11 am and faded to an 80% downside day by 4 pm.
Combined with yesterday’s rotation — daily, weekly, and monthly-down — and traders better be paying attention. I know I am.
Bottom Line: We’ve had some heavy selling the last few days. That could mean we are setting up for a larger washout, especially as the Fed gets a bit more hawkish and with the risk of the new variant/the headlines associated with the new variant.
Over the last 32 years, December has been higher 75% of the time, (trailing only April at 78% as the best-performing month). That does not mean we finish higher this month, but the seasonality is something to consider.
We are technically oversold at the moment. The question is, can a snap-back rally be sustained or will the market simply use the rallies as selling opportunities?
S&P 500 and SPY
Yesterday, I talked about the SPY and S&P 500 coming oh-so-close to the 50-day moving average and not tagging it. Instead, it gapped higher. I argued that it would have been healthier to start lower — like with a gap-down — and rotate higher.
But I don’t work the control station for the S&P 500 — we don’t control the tides, we just surf the waves when conditions are right.

The S&P futures were pushing higher overnight, but are now struggling with the 50-day moving average and breakout area. This zone, at least overnight, is acting as resistance.
If we push back through these marks, watch 4577 — last week’s low.
Notice the change in character. We have said repeatedly that the SPY/S&P have to regain the short-term moving averages and this week’s high. So far, both keep rejecting it.

The S&P index looks similar to the futures. We are a little higher in the pre-market, but those gains are fading as we type.
A gap-down open to the 21-week moving average followed by a reclaim of Wednesday’s low at ~4510 (for the SPX) could give bulls a move back up to the 4537 to 4550 area, as well as the 50-day moving average.
Back over the 50-day (and a close above it) opens the door for a little more breathing room on the long side. Otherwise, we need to remain cautious.
Nasdaq and QQQ

Yesterday I said the Nasdaq futures need to clear 16,436. Yesterday’s high? 16,427.50. So the NQ came within 7 points of this level and faded 600 points to yesterday’s low. This is why the levels matter so much.
From there, we said, “sell stops are likely building between 16,000 and 16,050. A break of this range could put 15,750 and the 50-day moving average in play.”
So far, the Globex high is 15,993. Last week’s low is 15,988. In other words, significant. The 4H 200-SMA also comes into play near 16K.
Above 16,000 and we could see the 10-day moving average at 16,130. Above that could put 16,250 on the table.
If we can’t sustain above 16,000, then the NQ may need to pay a visit to the 15,675 breakout area and the 50-day moving average. Last week’s low is already proving difficult, as seen on the 30-minute chart below.

As for the QQQ (below), it’s more of the same.
Bulls need it back above $389.80. If it can’t do it, it keeps the $382.50 area in play, along with the 50-day moving average.
Above $390 puts the $395 area on tap, where the QQQ currently finds the 10-day and 21-day moving averages. Pretty straightforward stuff.

Individual Stocks
Because of the wide ranges, we really need to be careful with the individual setups today.
One of my favorite things to do after a bad beatdown in the market is to look for relative strength (RS). That is, look for stocks that rallied in the face of all that heat.
Look at the semis/chips, like LRCX up 2%, AMAT up 3%, AVGO up 0.2% and ON up 0.44%. Some others in the group are bolded below.
Other RS names include:
KLAC
UMC
MCHP
*BLDR (notice the homebuilders/home stocks also doing well yesterday)
*LEN
*TOL
*LOW
INTU
PFE
STX
So what’s the deal with RS stocks? They don’t mean “go out and buy at the open today.” Not at all. It means you start collecting these stocks on a watchlist for when the market finds its footing. If it’s today or this afternoon, then great. If it’s next week, that’s okay too.
We simply want to see what stocks are holding up the best when the market is doing its worst.
They are the most likely candidates — like forcing a beach ball underwater — that will roar back to life once the buyers come back in. Below are a few industry looks based on the RS names above.

SMH – Semiconductors.
For now, holding up over last week’s low and well above last month’s low, as well as its shorter-term moving averages. It does not mean it can’t go lower, but it is holding up better than the SPX.
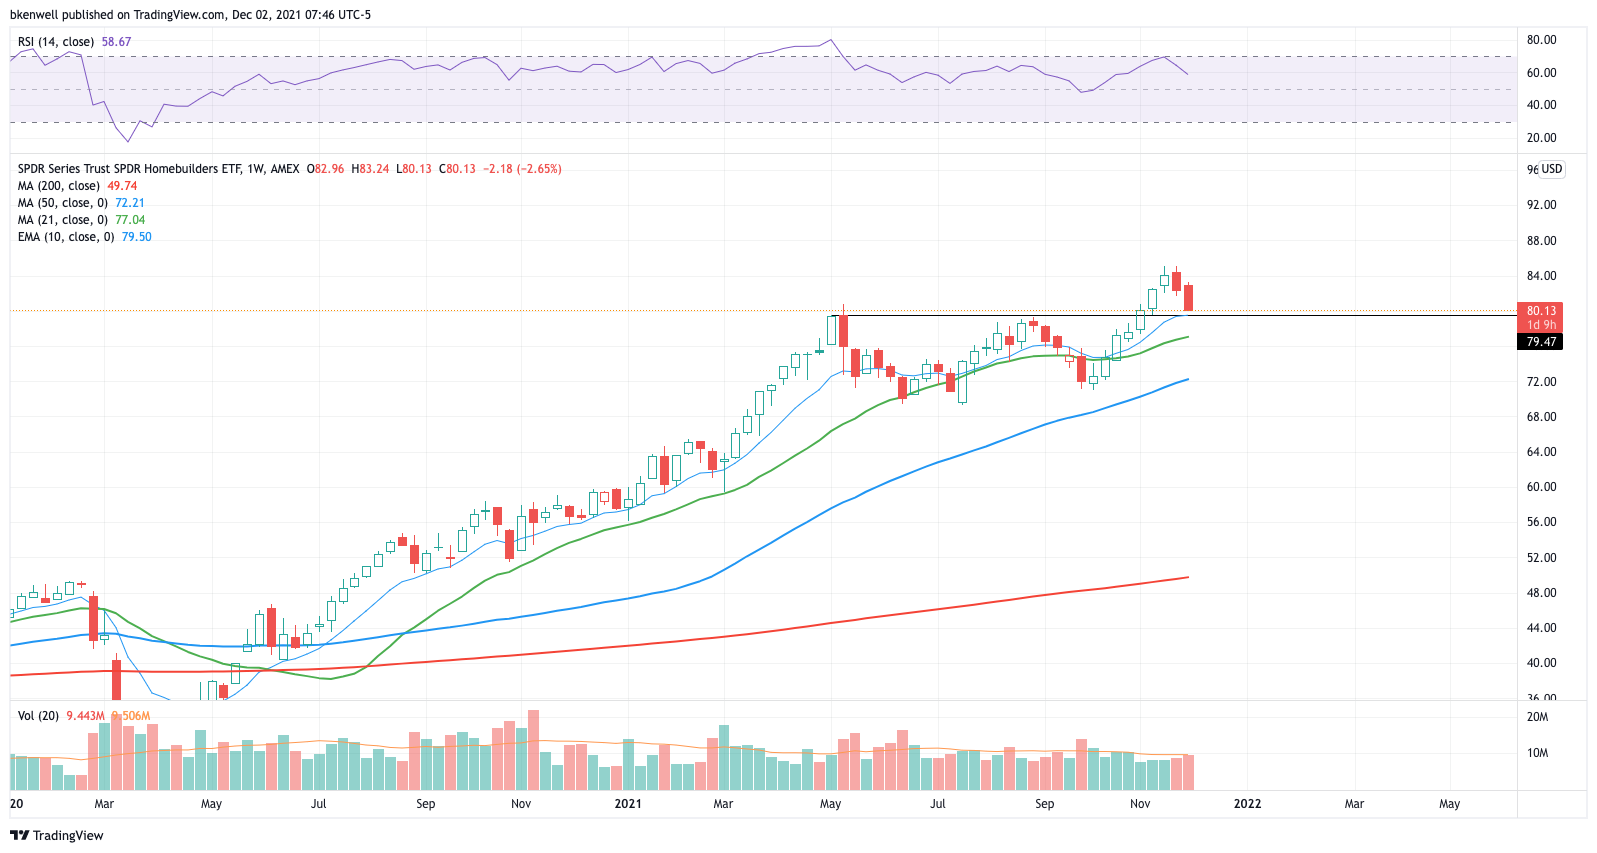
XHB – Homebuilders.
Could soon be testing into the 10-week moving average and the prior breakout area.
Disclaimer: Charts and analyses are for discussion and education purposes only. I am not a financial advisor, do not give financial advice, and am not recommending the buying or selling of any security.
Remember: Not all setups will trigger. Not all setups will be profitable. Not all setups should be taken. These are simply the setups that I have put together for years on my own and what I watch as part of my own “game plan” coming into each day. Good luck!
Economic Outlook

Comments are closed