We need some individual stocks to reset on the long side.
Follow @MrTopStep and @BretKenwell on Twitter and please share if you find our work valuable.
Our View
The long trade worked, but the late price action was a little disappointing for the bulls. I think most of the rally was just part of an options squeeze and gave us yet another “Fry-day” result.
This week will be all about the Fed and all about earnings.
We’ll hear from Meta on Wednesday, then Amazon, Apple, and Alphabet on Thursday. Those will be the highlight, as the four combined represent just over $5 trillion worth of market caps.
On the flip side, we’ll get the Fed’s FOMC announcement on Wednesday afternoon at 2 pm ET. This time though, the plans seem more telegraphed. The market is pricing in a 99.9% chance of a 25 basis point increase and the Fed has been vocal about getting rates up to about 5% and then going into a “wait and see” mode.
Our Lean
I was in the Keys for a wedding and had a 70-point lead in 2 ES contracts. However, a fellow trader mentioned the late-day weakness in the ES and I checked in with the Mr. Top Step chat room to see what was going on.
The ES had dropped 25 points and the Dow wiped out all its gains. My friend thought the ES was going to be down hard on Monday and I did too, so I got out on the close and this morning the ES is down 35 points.
Our Lean: Sell the rips with tight stops. There may be an opening long trade as the S&P comes into the week offside, but I want to get a look at that idea just before the open. If we get that pop shortly after the open, my gut says to sell it.
MiM and Daily Recap

The ES traded up to 4070.25 on Globex and opened Friday’s regular session at 4063.75 and then proceeded to trade straight up into 10:10 AM to a high of 4093.75. From there it traded down to a new low for the day session of 4063 at 10:55 AM, found support and traded in an upper channel to make a high of 4095 at 12:50 pm. It traded sideways until 1:15 PM and found support at 4083.75, then it traded up to the highs of the day at 4109.25 at 3:10 PM.
The ES traded 4094.50 as the 3:50 cash imbalance showed $674 million to buy, but the ES fell 10 points before bouncing and trading 4088.50 at the 4:00 cash close. It traded 4084 at the 5:00 close but finished higher by 8.75 points or 0.21% on the day.
In the end, the ES did take out the 4100 level, but fell hard late in the session. In terms of the ES’s overall tone, it was firm but the Dow (/YM) sold off over 200 points late in the day. In terms of the ES’s overall trade, volume was on the lighter side at 1.52 million contracts traded.
Technical Edge
- NYSE Breadth: 67% Upside Volume
- Advance/Decline: 69% Advance
- VIX: ~$19
After Friday’s late-day spill, I was looking for the market to come under some early pressure this week. Even when I was watching the Chiefs vs. Bengals game, the ES was struggling. That said, I did not expect the S&P to be down almost a full percent in Monday’s pre-market session.
Market-wise, we’re in an environment where we’re enjoying a really nice burst of bullish momentum, but we’re still in a bearish market with rising rates. Yes, they are not rising as fast and may soon stop rising altogether, but they are rising nonetheless and that is no friend of a bull market.
What I want: Ideally, the market will give us a couple of days of rest. Whether that’s sideways action or lower action, I don’t really care. But many individual names — like TSLA for instance — need a rest so we can have a better R/R when we approach these setups.
S&P 500 — ES Weekly
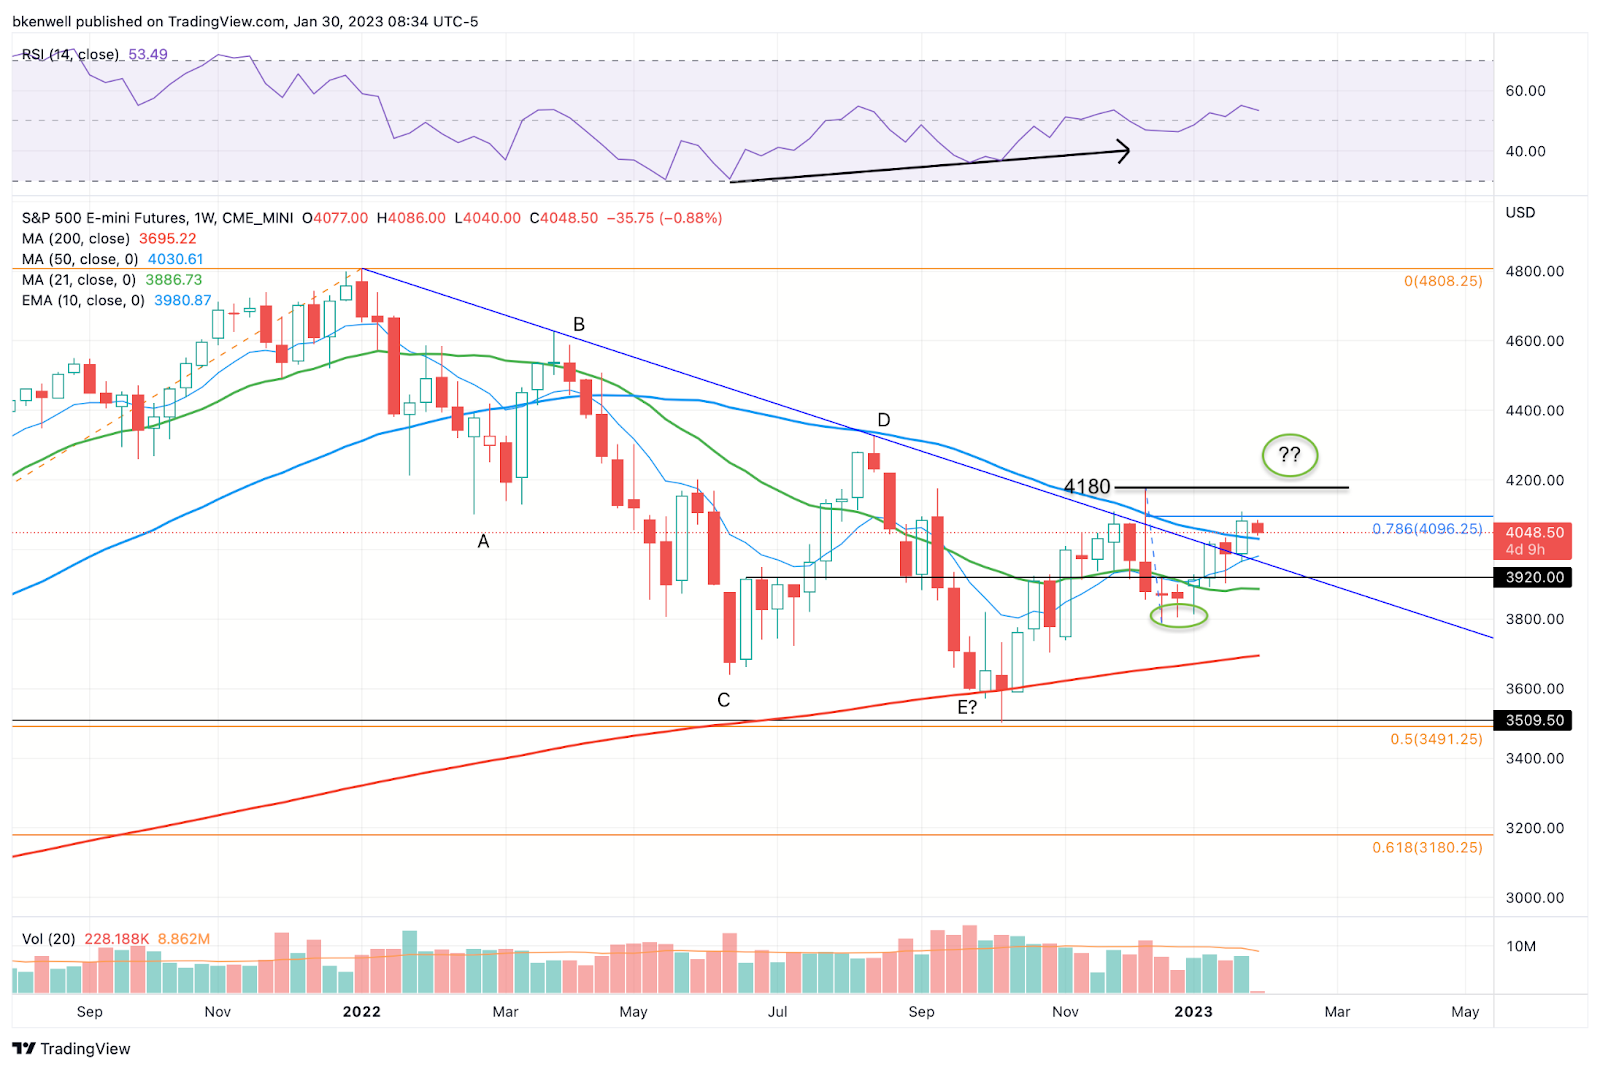
Leading off with a weekly view of the S&P futures, we got out first close above the 50-week moving average since early April. It’s our first close above downtrend resistance since the ATHs more than a year ago.
We now have a higher low in the books. The question is, can we get a higher high too, by taking out 4180?
That’s what the bulls will want to see and this week’s Fed and big-tech earnings could be a big part of that equation.

If we zoom in to the daily, we can see that the ES is finding some support in the 4040 to 4050 area, which was a trouble spot for longs last week.
If the ES takes out the Globex low after the open, keep an eye on that 10-day moving average at 4020 to 4025, which comes into play right between the 50% and 61.8% retracement.
SPY

I’m not sure that we’ll see $400 to $400.50, but it’s the first significant line of defense for the bulls. There we find former resistance, as well as the 50% retracement.
Below that puts the 61.8% retrace and 10-day moving average in play.
Aggressive bulls can look to see if we get an opening bounce of the $402.50 area. There we find the 10-ema on the 4-hour chart, as well as the high from Monday.

AQUA

I would still love a test of the $45.50 area.
Open Positions
A note: After talking to some members, I want to make the setups a bit more clear. We are a trade-ideas service, but want to make entries & exits simpler to understand. We will be sending more updates, a few educational pieces and looking for a way to make our setups more clear in how we are managing them.
- Numbered are the trades that are open.
- Bold are the trades with recent updates.
- Italics show means the trade is closed.
— Any positions that get down to ¼ or less (AKA runners) are removed from the list below and left up to you to manage. My only suggestion would be, B/E or better stops.
From this latest round, that includes TLT, DE and FSLR.
- COP — Long from $119, the 2x weekly-up. Trimmed ¼ at the 50-day. Still watching $123.50+ for the next trim. Can technically raise stops to $118-119 or B/E, (whichever suits your style better).
- If still long, $127 to $127.50 is the next trim spot
- NKE — Down to ⅓ or ½ after yesterday’s $128+ Trim. Looking for $130+ to exit more/all. B/E stop.
Go-To Watchlist
*Feel free to build your own trades off these relative strength leaders*
Relative strength leaders →
- AQUA
- AEHR
- MELI
- GE
- WYNN, LVS
- SBUX
- CAH
- BA & Airlines — AAL, DAL, UAL
- TJX, ULTA, NKE
- CAT
- AEHR
- HCCI
- FSLR
- XLE — XOM, CVX, COP, BP, EOG, PXD — (Weekly Charts)
Economic Calendar
None.
Comments are closed