Our View
From Friday’s low to Wednesday’s high, the ES has rallied 220 points or 4.9%. Pullbacks should be expected, but I am not going to deviate from the game plan even if the ES drops down to 4600 or more.
According to Jeff Hirsch from the @StockTradersAlmanac, the best time to get long is after December 13th. He also mentioned one of the most profitable year-end trades is buying beaten-down small-cap stocks and that the Santa Clause rally comes in the last five sessions of 2021.
I have followed STA for the last 25 years and when things line up correctly with your own work, it’s usually very effective.
Our Lean
So, where are we now? Yesterday’s plan to sell the rallies and buy the pullbacks worked very well in what was otherwise a very quiet session. As I said in the room, I like buying the 30- to 40-point pullbacks off a high. Yesterday’s Globex high was 4712 and the morning low was 4671.75, a dip of 40.25 points.
Our lean is to again sell the rallies and buy the pullbacks, and add to long positions if the ES is down hard late in the day — remember, it’s Thursday before Opex week. I am not going to add any more to this, as you know which way I am leaning and that is not going to change.
Also, keep in mind, it’s “Roll Day” for the index futures, as the futures contracts for December expire next week.
The Opening Print Recap
The ES traded up to 4612 at 6:57 am after Pfizer-BioNTech said that a booster shot offers protection against the Covid-19 Omicron variant.
After the rally, the ES sold back down to 4688 at 9:15 and opened Wednesday’s regular session at 4690.25. It was not like the last two sessions where breadth was high and bulls were in charge. This was more of a digestion day.
Right off the open, the ES sold off down to 4678.75, bounced back to 4697, and then pulled back and chopped around in a relatively tight range. It fell for four straight hours after the high, ending the 10 a.m. window at 4674.25, bottomed three points lower in the 11 a.m. window, and reversed higher.
From there, the ES climbed for five straight hours. At 3:00, the ES traded up to 4696 as the early MIM started showing $43 million to buy. After a small dip, it rallied to 4699 at 3:39, continuing to struggle with the 4700 area — which is not a new theme.
The ES traded 4703 as the 3:50 cash imbalance showed $2.6 billion to buy, but pulled back and closed at 4698.50 on the 4:00 cash close. It went on to settle at 4697.75 on the 5:00 futures close, up 12.25 points or 0.26% on the day.
In The End
In the end, the ES digested after a strong two-day rally — and that’s exactly what it should have done.
As I said in yesterday’s view, MrTopStep has a trading rule that the ES tends to go sideways to down after a big up day.
In terms of the ES’s overall trade, it shook off the early weakness and closed firm. In terms of the ES’s overall trade, 1.34 million contracts changed hands on the day. While not “low” necessarily, it’s the lowest volume we’ve seen since Nov. 19.
As we all know, there’s no crystal ball when it comes to trading stocks, options, or futures. But the Market Imbalance Meter may be as close as it comes. Knowing how the “Big Money” is placing its bets can give our trading room a big wave to ride — or a warning sign to stay out of the water. Come check it out now, risk-free for 30 days.
Technical Breakdown
- NYSE Breadth: 65.3% upside volume
- NASDAQ Breadth: 72.7% upside volume
Wednesday is exactly what the doctor ordered. Back-to-back days of strength in the S&P 500 put bulls back in control, vaulting the index back over last week’s high and all of its short-term moving averages. Breadth was robust during that two-day stretch.
Earlier this week, we said it would be a tall task to clear these measures and it was. If the S&P could do it though, we said it would put the all-time highs back in play. Technically, that remains true too. As Danny has long said, it takes days and weeks to bring the S&P down and just one session to bring it back.
We do have some potentially choppy events to navigate, starting with today’s “Roll Day.” Next Friday is quad-witch expiration, as well. The latter can lead to choppy price action early in the week too.
Keep these things in mind if you’re a swing trader, as this type of price action tends to frustrate investors.
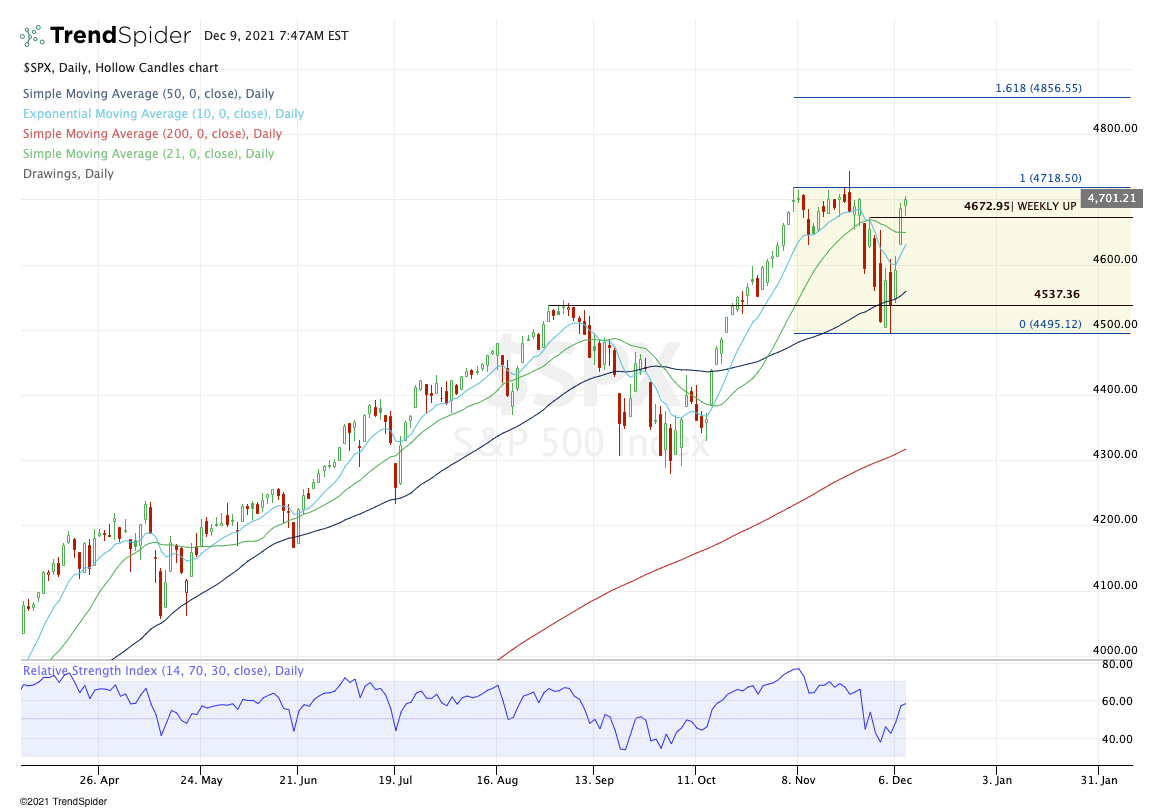
S&P 500
Monday’s action gave bulls hope, while Tuesday’s action left little doubt in investors’ minds about which side was in control.
Yes, the index can try to make new highs and fail, but if bears really had control, they would have kept the trend in their favor.
On the upside, the task at hand is clearing the 4810 to 4820 area. If it can do that, the ~4844 high is on the table. On the downside, let’s see if we can close above 4673 — giving us a weekly-up close.
QQQ

The QQQ has also had a few strong days but has yet to go weekly-up. That’s likely as it’s had more selling pressure overall in the correction (just look at growth stocks).
If the QQQ can go weekly-up over $401.19 and close the week like this, it will be an impressive feat for the bulls. That said, we’re currently working on an inside week, (with this week’s range completely contained within the prior week’s range).
I noticed that in a lot of growth stocks during my nightly scan, too.
This could set us up for an inside-and-up rotation next week, but let’s not get too ahead of our skis. For now, I’m watching $401.19 and $401 resistance on the upside, and the 10-day and 21-day moving averages on the downside.
Individual Stocks — NVDA, QCOM, DHI, COST, TOL
In all, it’s been a quiet stretch as far as individual stock setups, but it’s been fairly rewarding. Our trade in ARKK has done fantastic and has some traders wondering if we just caught the bottom. We’ll see as time goes on, but we have a lot of cushion on our trade to find out.
Even just yesterday, we knew to be cautious of Semiconductor stocks even as I like the group as a whole and as it’s been a relative strength leader, along with housing. So I think the navigation has been pretty clean!
Nvidia
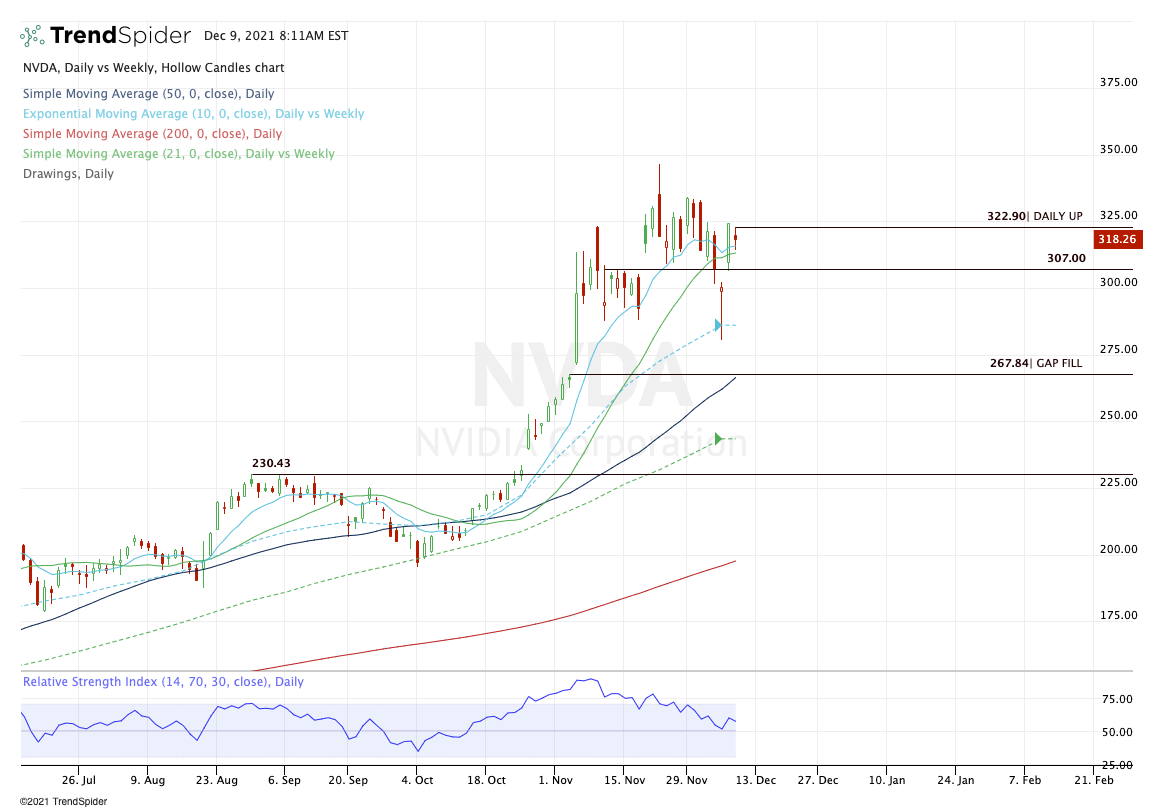
Yesterday for Nvidia, we said: “In reality, an inside day would be most constructive here.”
Well, that’s exactly what we got. Now an inside-and-up rotation takes place on a push over $322.90. That is what I am watching for today. Over $325 could put the $333 to $335 area in play.
Remember, don’t get caught in a false rotation!
Qualcomm

There’s a similar setup in QCOM.
Costco — Earnings

Costco has been a beast, but it put in a bearish engulfing stick yesterday. This one reports earnings after the close. It may not necessarily be a trade candidate on Friday, but I want to put some key levels on the radar.
The first area is $510 to $514, where it finds the 10-week moving average and last week’s low.
The second is $497 to $500, where it finds the prior breakout level and the 50-day moving average.
DHI

DR Horton (DHI) is a really interesting candidate.
I’m looking at a stock that just made new highs and closed higher by 0.77% on the day. However, it did so with bearish divergence (bottom of the chart) and stalled at the prior high of $106.89.
Further, it gave us a doji day (indecision) and on the raindrop chart, it actually suggested a lower close based on where the volume took place (these charts take a little getting used to).
Put it all together and — as much as I don’t like fading relative strength stocks in relative strength groups — we could be looking at some type of pullback here.
A push above the new high at $108.09 and failure to hold above it could be one entry. Another could be a doji-down rotation through Wednesday’s low at $106. In the latter, we would use Thursday’s high as our stop (assuming it’s reasonable).
The trade would be looking for just a few bucks — and once in the green, we wouldn’t want it to go against us — so it’s not for everybody. But it’s something that caught my eye when flipping through the new-high list.
Disclaimer: Charts and analyses are for discussion and education purposes only. I am not a financial advisor, do not give financial advice, and am not recommending the buying or selling of any security.
Remember: Not all setups will trigger. Not all setups will be profitable. Not all setups should be taken. These are simply the setups that I have put together for years on my own and what I watch as part of my own “game plan” coming into each day. Good luck!
Economic Outlook

Comments are closed