Our View
There is always something going on…the two-day Fed meeting, the June Quad Witch, bank stress test, Russell Rebalance, and the end-of-the-quarter rebalance. The markets are “punch drunk” and next week could prove to be a very busy week.
Look, I do not think this gets any easier. The summer markets seem to have hit early — meaning lower volume and potentially erratic movement — but that does not mean there won’t be raids. Two things that could help the markets right now? If the US steps up its oil and gas production (being talked about in the Biden admin) and if Putin calls for a truce (and that seems unlikely). Even if we increase our own energy production, that will take a while to have an effect.
The US is stuck in the hurt locker with rising rates and record debt. Globally though, things are worse. Third-world countries are starting to have real shortages, while other developed nations now face rising rates and even higher energy prices.
Most of us knew that this day would come if the Fed kept printing money. Now the big question is, how long and how deep will the S&P correction go? I do not pretend to be smarter than anyone else, but my street smarts say we are not done yet and it’s not going to be pretty.
Will things get better? Of course! But we have to remain patient. I still plan on scaling into some stocks in late Q3 or in Q4. Right now there are just too many risks still, even though the S&P 500 has corrected by more than 25%.
Our Lean
As bearish as that sounds, we can bounce in the short term. Don’t forget, we just had back-to-back weeks with 5%+ losses. (I need to get the stats on when that happens and what follows). In any regard, we’ve also fallen in 10 of the last 11 weeks.
So at some point — even if the conditions of the economy don’t improve — an oversold bounce would not surprise me.
In Globex, the ES has cleared the brick wall that has been 3800. It is very key that the ES holds above this level now.
If we fade all of these gains going into the weekend, that’s an ugly situation for the bulls. However, this rally feels like there could be more gas in the tank.
If the bulls hold the 10-day and 3800 as support, look for another push higher. Specifically, I’m looking for a potential push to the 3890 to 3900 area — so is the Pit Bull — and traders can look to buy the 30- to 50-point dips.
Daily Recap
The ES traded up to 3797 at 6:25 am and opened Thursday’s regular session at 3783.75. After the open, the ES rallied up to 3791.50, and over the next 15 minutes, the futures traded back down to 3765 at 9:50. At 10:00, it traded up to a new high at 3793.27.
After another pull back down to 3770.50 at 10:10 and at 11:10, the ES traded back up to another new high at 3799.25. It was a choppy start with an upside bias, but the bulls could not push through 3800.
After the ES sold off 55 points down to 3745.75 going into 1:00, it then rallied all the way up to the 3798.75 at 3:35 (a 53-point move) and then up inched up to 3802.25 at 3:48. It hit its session high of 3805.75 as the 3:50 MIM cash imbalance showed $1.5 billion to buy. The ES dipped back down to 3793.75 and closed 5 points above that level at 3798.75. After the US bank stress tests results hit the tape, the ES sold off a little more, settling at 3782.25 at 5:00, up 24 points or +0.64% on the day.
In the end, it was like I wrote in yesterday’s OP: selloff on Globex, rally, then fail at 3800. In terms of the ES’s overall tone, it was firm but stuck in that failed rally that’s been going through the last few days. In terms of the ES’s overall trade, volume was low again, at 1.57 million contracts.
- Daily Range: 70.75 points
- H: 3805.75
- L: 3735
Technical Edge
- NYSE Breadth: 48% Upside Volume
- NASDAQ Breadth: 70% Upside Volume
- VIX: ~$28.75
Game Plan — S&P 500 (ES & SPY), Nasdaq (NQ & QQQ), Oil
S&P 500 — ES

The ES is clearing 3800 this morning, which is incredibly key. If it can hold above this level, then the gap-fill at 3896.50 is a possible upside target, preceded first by last week’s high at 3878.50.
On the downside, a break of 3800 puts the Globex low in play near 3781. Below that and 3750 or lower could be in play.
S&P 500 — SPY

SPY is trading $381 as of 8:30 ET. If we open here, it will get us back above the key $380.54 level.
Above that opens the door to $384 (last week’s high) and above that puts $389.75 in play. That would likely take a multi-day move to hit the latter — if we hit it at all.
The risk for the bulls? Fading from the $380.50 to $381 zone. If that happens, yesterday’s high will be the first test at $378.83.
Given the significance of $380.54 and the declining 10-day, a cash-flow (day trade) short may be a good risk/reward near the open, looking for a small fade early in the day. For others though, the small-change won’t be worth the effort/risk and that’s fine too.
Nasdaq — NQ

Yesterday’s plan read like this: “If we can clear 11,675 and hold this area as support, look for 11,750 on the upside. Perhaps if we have strong enough breadth, then the gap-fill is in play.”
We did not get the gap-fill yesterday, but we’re getting it right now during Globex.
If the NQ is rejected from this area, bulls need to see the NQ hold the 10-day moving average and the Globex low at 11,685 — 10 points about the recent key level of 11,675.
If it can’t, sub-11,600 could be in play.
If it can hold support or if it continues higher from here, look for 12,000 to 12,050. That’s the 50% retracement and the 21-day moving average.
Russell 2000 — RTY

Like the Nasdaq, the RTY has been one of the downside leaders amid this bear market. Now it’s rallying back into a prior support area and the 10-day moving average. The latter is active resistance, while the former could become resistance.
Let’s keep an eye on the 1730 to 1735 area. If RTY can clear this zone, then the 1750s are in play, then the 1770s. However, if this area is resistance, be wary of how the other indices will trade.
Oil

This has been a mixed and quite frankly, unfavorable week for oil. However, yesterday gave us a very clear inside day. Despite a near-$5 trading range, CL closed within 15 cents of where it opened.
That said, we’re below the trend line, as well as the 10-day, 21-day and 50-day moving averages while commodities get whacked.
If oil can go inside-and-up and clear Thursday’s high, then $110 could be back in play.
If oil goes inside-and-down, then $100 or lower is in play, with this week’s low sitting at $101.53.
Copper — HG

We don’t talk about Dr. Copper all that much and anyone trading it must remember that HG is a big contract capable of big moves. That said, let’s start to pay attention if we see a move into the $3.30 range.
That was a big breakout point and where we find the 200-week moving averages. Just above that, we have the 50% retracement near $3.50 too.
Like Bitcoin, it’s one to watch even if we’re not trading it.
Go-To Watchlist — Individual Stocks
*Feel free to build your own trades off these relative strength leaders*
- Numbered are the ones I’m watching most closely.
- Bold are the trades with recent updates.
- Italics show means the trade is closed.
- DXY / UUP — Still carrying ¼ of the original trade (cost basis: $27.20) but out of the second trade, after the remaining ½ triggered our break-even stop-loss.
- On the upside, I’m still looking for $28.20+ to trim more.
- $28.50 to $28.65 is the next meaningful upside target.
- On the downside, my last ¼ will operate against a B/E stop-loss too.
- On the upside, I’m still looking for $28.20+ to trim more.
- MCK — Looking for $320 to $325 for another trim and raising stops to $305.
- SLB — Triggered on yesterday’s dip and we got a nice rally for some cash flow. Otherwise, a $36 stop-loss works just fine here.
Relative strength leaders (List is cleaned up and shorter!) →
- BMY
- XLE
- MTDR
- AR
- CLR
- VRTX
- DLTR / DG
- IBM
- ARCH
- NVA
- MCK
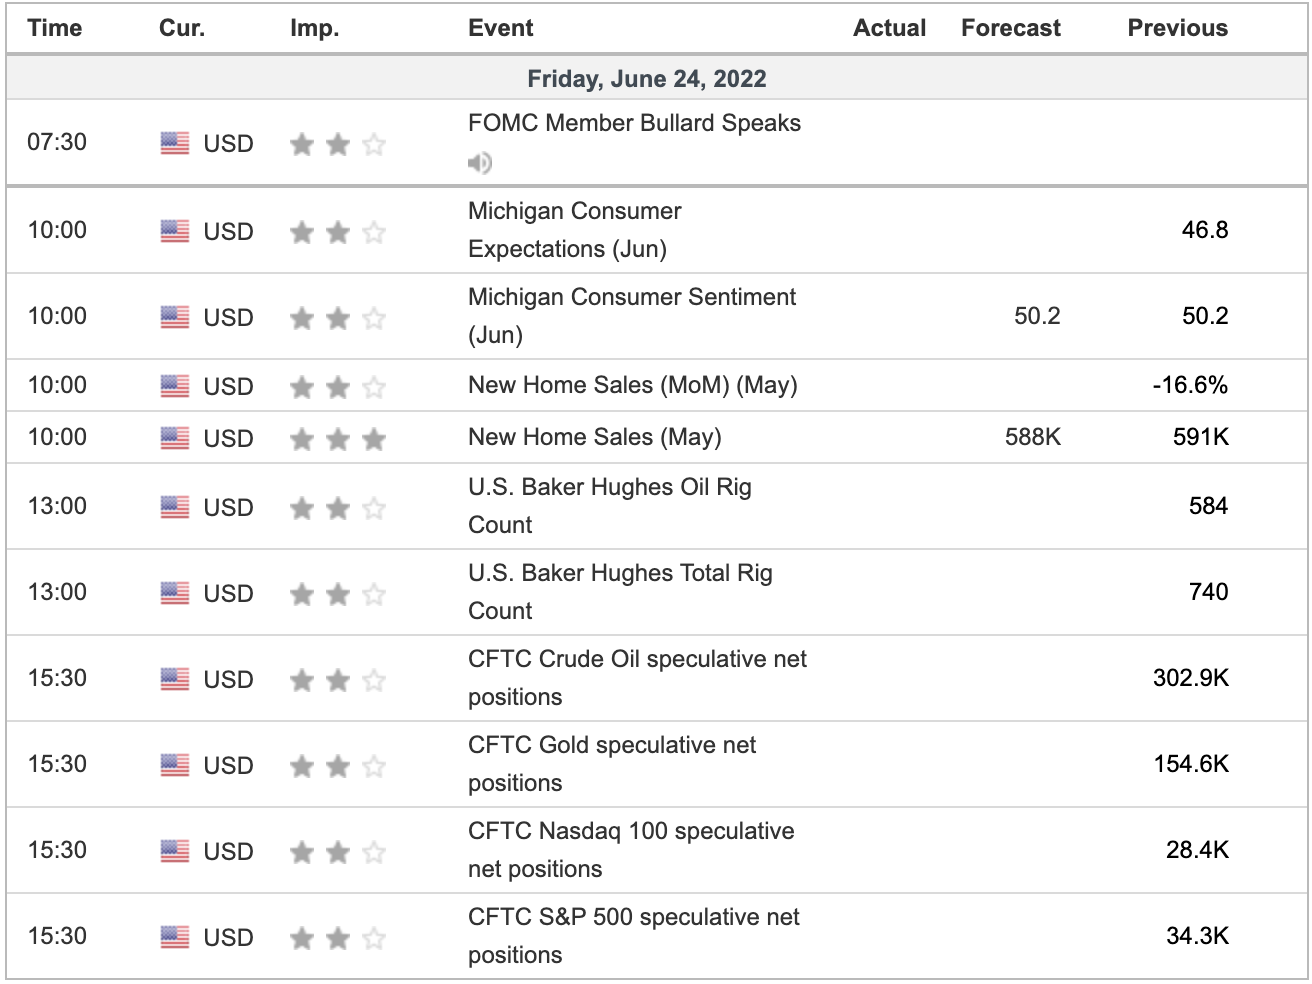
Economic Calendar
As we all know, there’s no crystal ball when it comes to trading stocks, options, or futures. But the Market Imbalance Meter may be as close as it comes. Knowing how the “Big Money” is placing its bets can give our trading room a big wave to ride — or a warning sign to stay out of the water. Come check it out now, risk-free for 30 days.
As we all know, there’s no crystal ball when it comes to trading stocks, options, or futures. But the Market Imbalance Meter may be as close as it comes. Knowing how the “Big Money” is placing its bets can give our trading room a big wave to ride — or a warning sign to stay out of the water. Come check it out now, risk-free for 30 days.
Comments are closed