Our View
We are due for an oversold bounce, the only question is: Can bulls actually prove they are in the driver’s seat for more than a few sessions?
The S&P 500 (ES) has declined in 10 of the last 11 weeks and in that span, it has fallen 992 points from the high to the low. Even from a bearish perspective, that’s due for a bounce at some point.
The bulls did a good job of buying the opening dip yesterday, even though they couldn’t close it strong. We’ll see if they have what it takes to push the indices higher today, which is Day 2 of the Powell testimony.
I will just say this: The market is eventually due for a rally and right now, we’re getting one even though it’s modest so far. But it seems like nothing much beyond short-covering. Don’t mistake it though, short-covering rallies can gain some serious steam if shorts get too far offside.
Our Lean
3807 was the May low, which preceded a near-400 handle rally. That was a solid bear-market rally, a dead-cat bounce — whatever you want to call it, it’s all the same thing.
Last week, this 3807 area was resistance and it was on Wednesday as well, which had a high of 3805.50. To me, it’s the key for today as well.
Can the ES clear this level? If so, 3835 to 3840 is in play. That’s followed by 3875, then 3895.
Daily Recap
After rallying up to 3783.75 on Tuesday, the ES sold off down to 3693.25 on Globex and opened Wednesday’s regular session at 3724, down more than 40 points from the prior close.
After the open, the ES made an early low of 3719.50 and then roared higher by 74 points up to 3797.75 just after 10:30. From there, the ES pulled back 39 points down to a low of ~3759 at 12:00, before rallying 46 points up to new highs at 3805.50 at 2:15.
The next move was back down to the 3887 level at 2:43 and back down to the 3760.50 area. The ES traded 3765 as the 3:50 cash imbalance showed $1.3 billion to sell, then traded 3760.75 on the 4:00 cash close and settled half a point lower at 5:00, down 9.25 points or -0.25% on the day.
In the end, we had a huge range when we accounted for all the swings (250+ points) even though the end result was just a sub-10 point dip on the day. In terms of the ES’s overall tone, it was a mess in both directions. In terms of the ES’s overall trade, total volume was 1.61 million contracts traded, low for the size of the moves and marks the second session in a row with below-average volume (the 20-day average is 1.92 million contracts).
- Daily Range: 112.25 points
- H: 3805.50
- L: 3693.25
Technical Edge
- NYSE Breadth: 40% Upside Volume
- NASDAQ Breadth: 55% Upside Volume
- VIX: ~$29
Bulls did a good job fighting off Wednesday’s opening dip. The S&P now faces a very key area on the chart, while the VIX is finally sub-$30 again.
Game Plan — S&P 500 (ES & SPY), Nasdaq (NQ & QQQ), Oil
S&P 500 — ES

The chart above is beautiful. You can see so many key things all at once with just a glance.
Look at the way the prior low — 3807 — marked the bottom in May, then was cut through like a knife in June and resistance late last week. Now we’re seeing it act as resistance again this week.
Traders can also see active resistance in the form of the 10-day moving average.
Bulls want to go on a meaningful bear-market rally? Gladly. They can start their “prove-it campaign” by closing above the 10-day moving average and the 3807 mark. This zone is very key.
Clearing these two levels puts 3835 to 3845 in play, the two wick-highs from last Wednesday and Thursday. Above that puts last week’s high in play near 3875, followed by the gap-fill at 3896.50.
On the downside, watch the Globex low at 3735. Below that could open the door to yesterday’s low around 3695.
S&P 500 — SPY
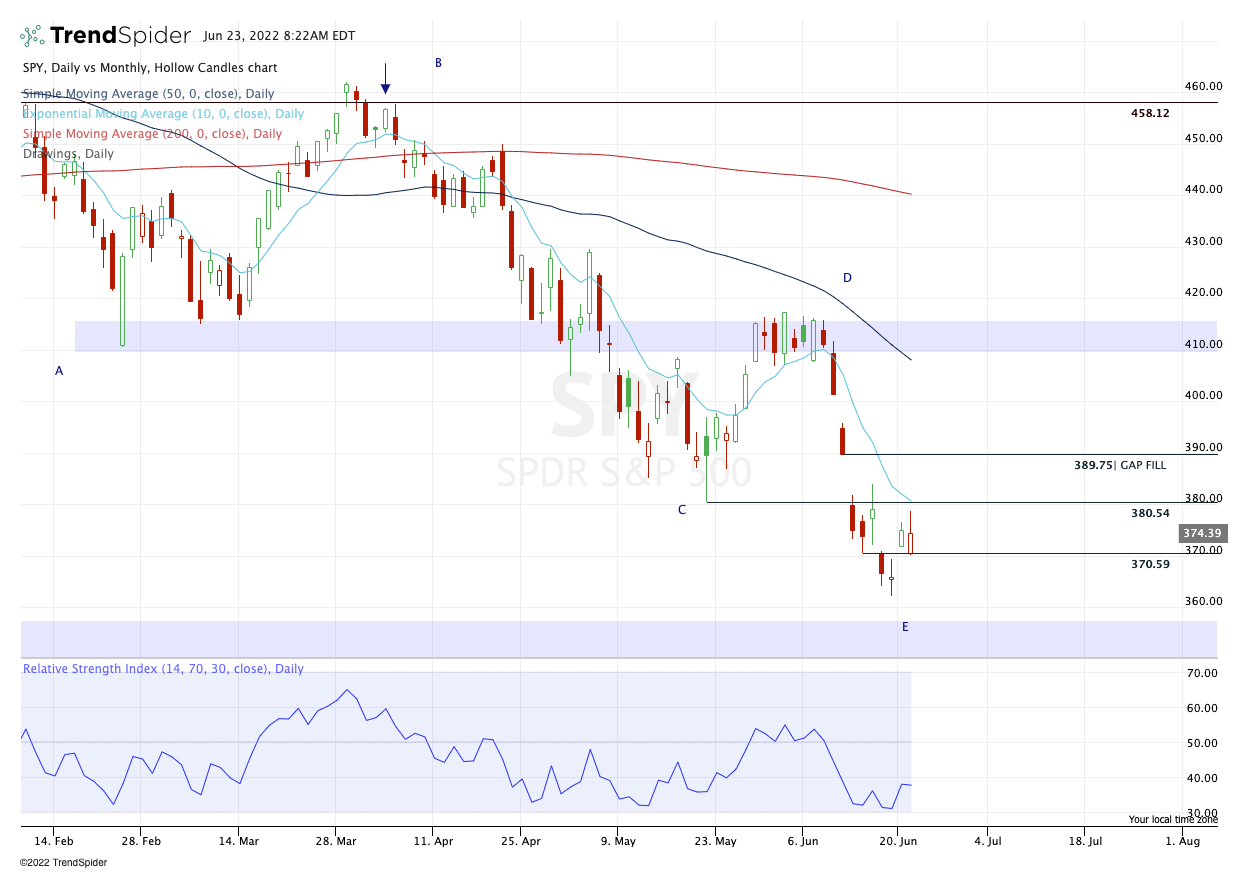
For SPY, it’s pretty cut and dry: bulls need to hold $370 and reclaim $380.
$380.54 was the May low that’s now acting as resistance. Further, the 10-day is near this level as well. Above this area opens the door to last week’s high at $383.90, followed by the gap-fill level at $389.75.
On the downside, $370 has been both support and resistance over the last week, but was most recently support yesterday. Losing it and failure to reclaim it likely puts the lows back in play.
Nasdaq — NQ

Yesterday we called out the 11,675 level and its importance. I think that remains the case today, too.
Above this mark and Wednesday’s high near 11,750 is in play. Above that potentially puts another 100 points on the table to the gap-fill level near 11,850.
The approach is this: If we can clear 11,675 and hold this area as support, look for 11,750 on the upside. Perhaps if we have strong enough breadth, then the gap-fill is in play.
On the downside, a break of the Globex low at 11,460 could put the 11,275 to 11,300 area in play.
Nasdaq — QQQ

We need a close over the 10-day to have any sort of meaningful development in the QQQ. daily-up over $285.18 opens the door to $288.40.
Below $277.75 and the QQQ might retest the lows. It’s as simple as that.
Oil

Yesterday’s rebound was encouraging, then CL opened lower again today. If it can reclaim $106.50 and press higher, I’ll be impressed.
Otherwise, this one looks like it could be vulnerable right now. $100 is incredibly key on the downside.
Go-To Watchlist — Individual Stocks
*Feel free to build your own trades off these relative strength leaders*
- Numbered are the ones I’m watching most closely.
- Bold are the trades with recent updates.
- Italics show means the trade is closed.
- DXY / UUP — Still carrying ¼ of the original trade (cost basis: $27.20) but out of the second trade, after the remaining ½ triggered our break-even stop-loss.
- On the upside, I’m still looking for $28.20+ to trim more.
- $28.50 to $28.65 is the next meaningful upside target.
- On the downside, my last ¼ will operate against a B/E stop-loss too.
- On the upside, I’m still looking for $28.20+ to trim more.
- MCK — I’m into the second trim zone on MCK, at least getting down to a ½ position here. We are now into the weekly-up level and the 10-week moving average. If MCK can clear this zone, $320 to $325 could be in the cards for another trim. Otherwise, a B/E stop works fine.
- SLB — Triggered on yesterday’s dip and we got a nice rally for some cash flow. Those that didn’t trim yesterday, I would consider doing so with ~1% pre-market gains and/or near the open unless you’d like to hold out for hopefully higher gains in the form of a swing trade.
- Otherwise, a $36 stop-loss works just fine here. I like to trim to get ahead in the position and put $$$ in my pocket, but everyone’s different.
Relative strength leaders (List is cleaned up and shorter!) →
- BMY
- XLE
- MTDR
- AR
- CLR
- VRTX
- DLTR / DG
- IBM
- ARCH
- NVA
- MCK
Economic Calendar

As we all know, there’s no crystal ball when it comes to trading stocks, options, or futures. But the Market Imbalance Meter may be as close as it comes. Knowing how the “Big Money” is placing its bets can give our trading room a big wave to ride — or a warning sign to stay out of the water. Come check it out now, risk-free for 30 days.
As we all know, there’s no crystal ball when it comes to trading stocks, options, or futures. But the Market Imbalance Meter may be as close as it comes. Knowing how the “Big Money” is placing its bets can give our trading room a big wave to ride — or a warning sign to stay out of the water. Come check it out now, risk-free for 30 days.
Comments are closed