Back-to-back big breadth days have traders wondering.
Follow @MrTopStep and @BretKenwell on Twitter and please share if you find our work valuable.
Don’t Forget: We recently noted the long-term performance of the S&P 500 (and what that means for investors and traders), and we also took a look at some longer-term setups for those interested.
Our View
I am happy for the bulls. It’s been a shitty year and they deserve some reprieve, but it comes down to the same old questions. Is the low in or will this rally end up like all the others so far…a dead cat bounce?
I am always an optimist at heart and I would love for the ES and NQ to “just keep going up” and for the ES to go back to 4600 by year-end, but I think that’s being overly optimistic. I guess the question comes down to, what’s changed?
Is the Fed going to stop raising interest rates? Is inflation going to fall? Will energy prices continue down? Will the bond market level off? Is Putin going to take his troops and go home? I doubt it. Maybe we do rally at year-end, but right now I’m still focused on the larger trends in play.
That said, there are certainly some positives to take away from the recent action.
Our Lean — Danny’s Take
The ES is over-extended after a 200+ point rally in two days. While the “bulls are back,” we still want to approach the rally with caution.
This is not to say it can’t keep going up, but we still think this is a bear-market bounce until proven otherwise. Case in point, 3949 — the 50% retracement — could still be in play and is a level we’re watching on the upside.
Our lean is to sell the rips today with tight stops, especially as we come into the session down about 40 handles. Watch a rally back up toward the 3800 area. First test of this zone likely gives us a chance to sell.
Daily Recap
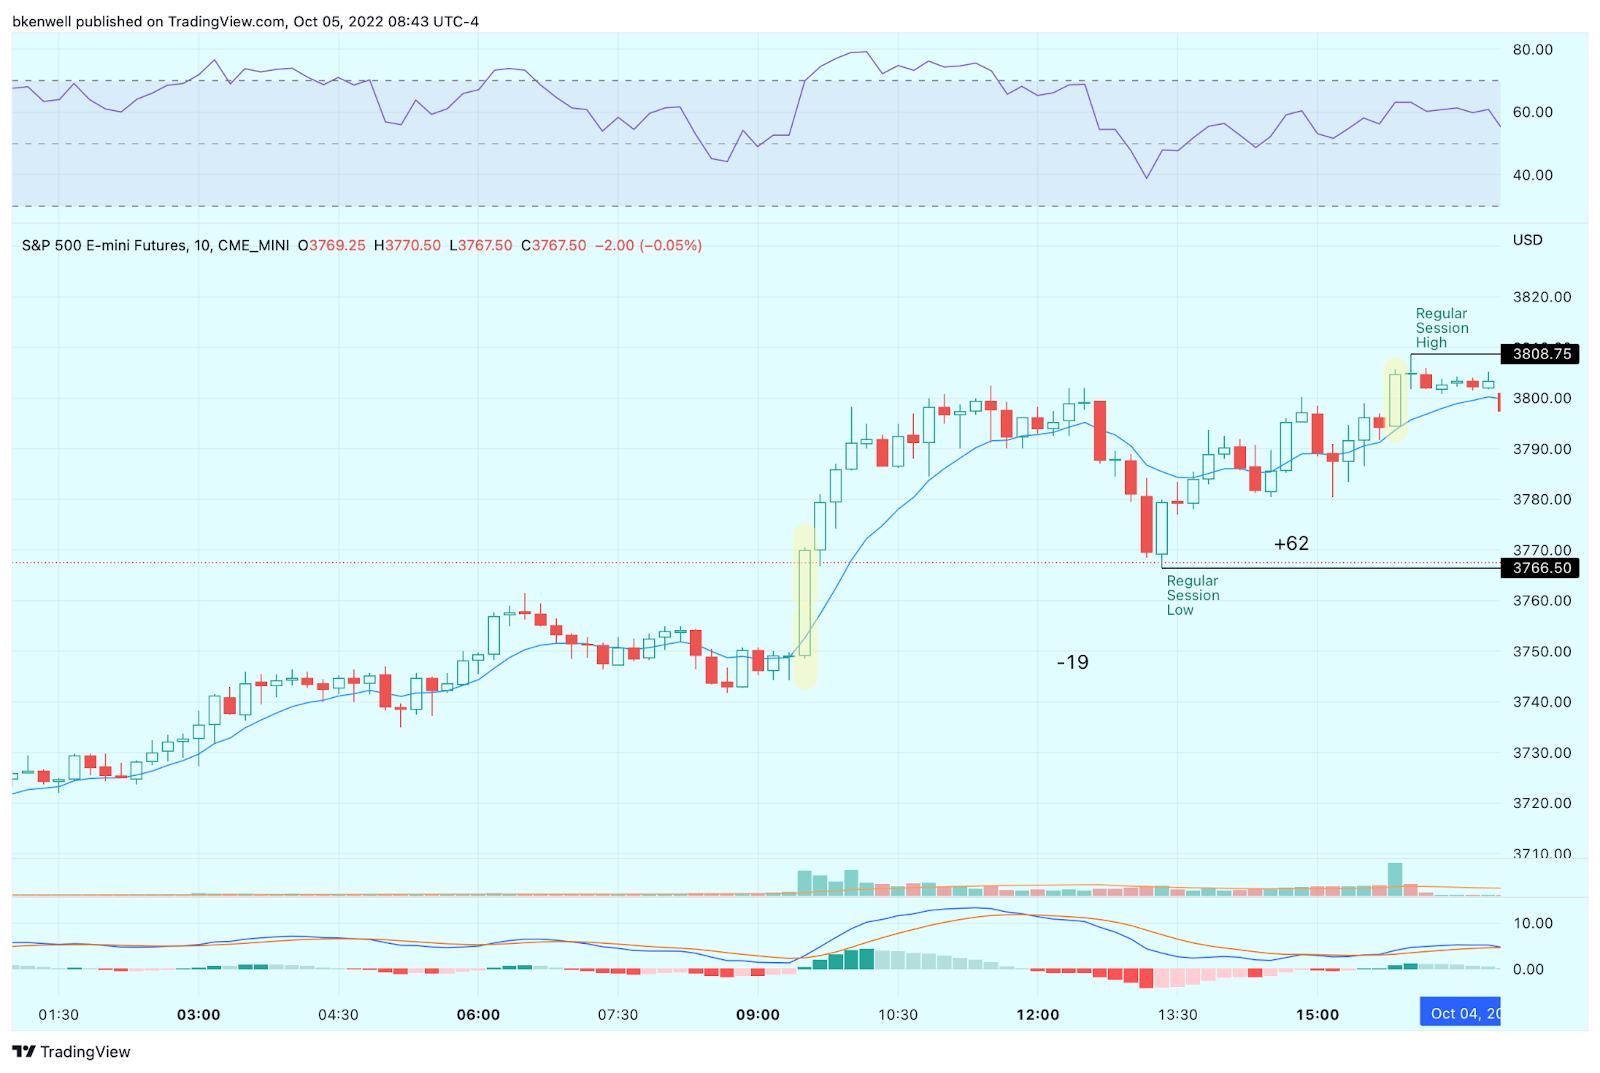
After trading down to 3686.25 and then rallying up to 3761.25 on Globex, the ES opened Tuesday’s regular session at 3749.25. After the open, the ES quickly rallied up to 3798.25 at 10:02. After the high, the ES pulled back down to 3784.50 at 10:51.
From there the ES rallied up to 3802.50 at 11:32 and then quickly sold off down to 3766.50 at 1:20, rallied up to a lower high at 3793.75 and sold back off down to 3780.50 at 2:30. The ES rallied back up to the big figure at 3800.25 at 2:57 and then traded back down to the 3780.50 are at 3:11, then again traded back up to 3799 at 3:40.
The ES traded 3794.50 as the 3:50 cash imbalance showed $1.1 billion to buy, traded 3804.75 on the 4:00 cash close and settled at 3803.50 on the 5:00 futures close, up 109 points or +2.95%% on the day and up 230 points from Sunday night’s Globex low, or up more than 6%.
In the end, it was a ‘monster mash’ for the short sellers as they continue to get squeezed out. In terms of the ES’s overall tone, it was firm all day. In terms of the ES’s overall trade, volume was steady at 2.3 million contracts traded, although that was below the 20-day average.
- Daily Range: 117 points
- High: 3808.75
- Low: 3686.25
Technical Edge
- NYSE Breadth: 95% Upside Volume (!!)
- NASDAQ Breadth: 91% Upside Volume (!!)
- VIX: ~$29.50
If you missed it yesterday, here was a recent setups list for individual stocks.
Game Plan: S&P, Nasdaq
We’re trying to balance the “Big Picture” and the day-to-day action.
For instance, the dollar is up and bonds are down this morning (the latter, bonds, are a bit concerning in general but more on that in a minute).
However, the market just gave us two very, very robust days of upside breadth, with an 88.9% upside day on Monday and a 95% upside day on Tuesday.
Advance/decliners were 82.8% and 86.2%, respectively.
I would have preferred a 90/90 day in there, but back-to-back 80/80 days is impressive. For what it’s worth, 90/90 days tend to foreshadow much larger rallies.
Still, though, this has me wondering if this low could be the low for a while. Even if it gets retested, could this rally have legs for a while?
S&P 500 — ES

We noted a cash flow trade yesterday that didn’t come to fruition and said, “Otherwise, if the ES reclaims 3751 and stays above it, it could put another hundred handles in play up to 3850 and the 21-day.”
That could be the course of action from here, with the 10-week looming just a bit higher beyond 3850.
Down about 38 handles this morning, we finally have a dip to work with. Bulls want to see support from the 3740 to 3750 area. There we have a ton of measures to note:
- The 50% retrace of yesterday’s range
- 10-day moving average
- Last week’s high
- Prior support from July turned resistance in September and reclaimed yesterday.
If all of these hold, it’s a buyable dip for the bulls. For what it’s worth, the 10-ema on the H4 chart is also in play at 3755.
ES — 4H Chart

If it helps for visuals, there’s the H4 chart above.
SPY
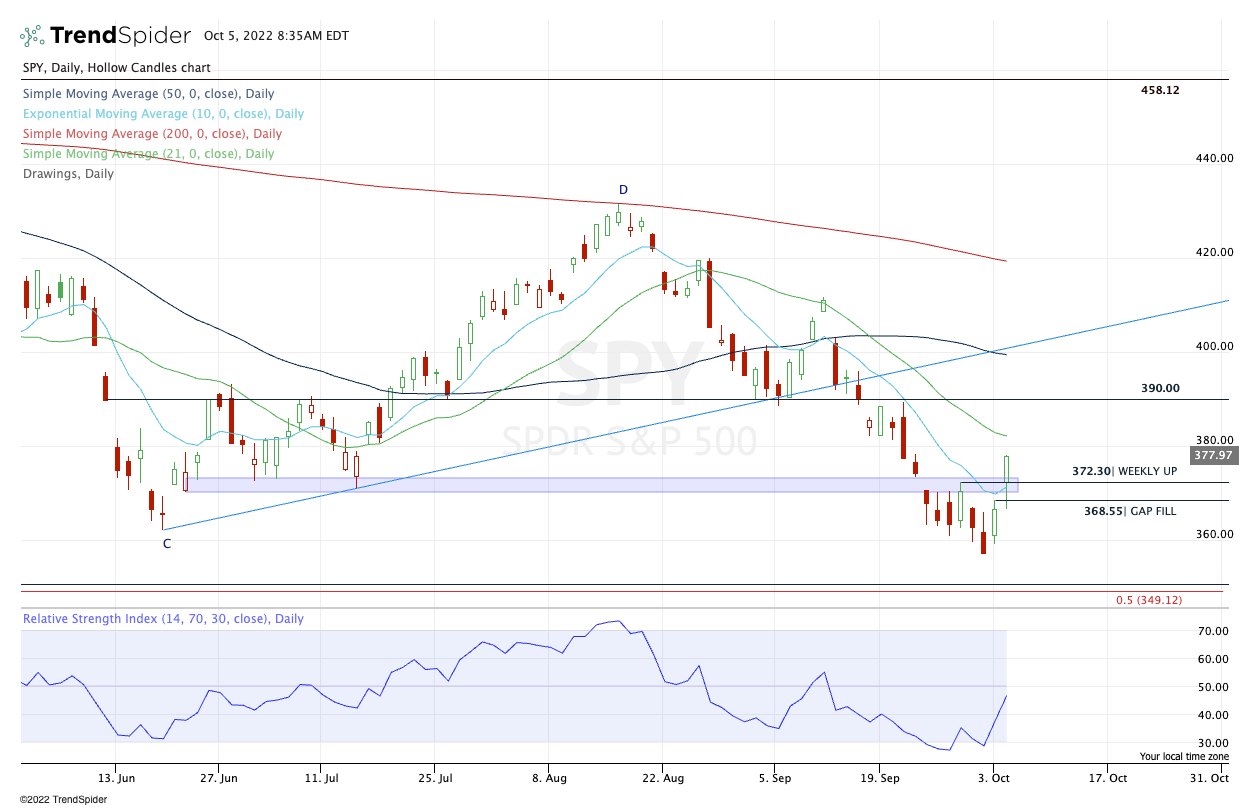
I want to see the $370 to $372 area hold as support — and closer to $372. If lost, we have an open gap on the chart (even though it doesn’t show on the daily) at $368.55.
Over $372.30 remains bullish to my eye.
Bonds — TLT

Premium members who have been here for more than a few months know the bonds have been a concern for me, specifically since Aug 8. They are often a canary in the coal mine.
The SPX enjoyed a big rally yesterday, fueled by the decline in the dollar. But the bonds didn’t participate, falling 28 basis points.
The TLT has been stuck below $105 and is now trading just under $103 in the pre-market.
If this rolls over and if the dollar bounces further, stocks could struggle IMO. While stocks could also break their correlation to these assets, they haven’t yet.
Go-To Watchlist
*Feel free to build your own trades off these relative strength leaders*
- Numbered are the ones I’m watching most closely.
- Bold are the trades with recent updates.
- Italics show means the trade is closed.
Notes:
MCK — weekly-up triggered from our buy list.
Relative strength leaders →
Top:
- ENPH — holding the breakout near $269 — Great Setup
- LNG — nearing the breakout near $150 — Monster Reaction
- MCK — holding the breakout near $340
- CAH — holding the breakout near $64
Here’s a quick look at the stocks above (in the Opening Print Twitter Community).
- FSLR
- ALB
- VRTX
- CYTK
- CELH
Economic Calendar

Comments are closed