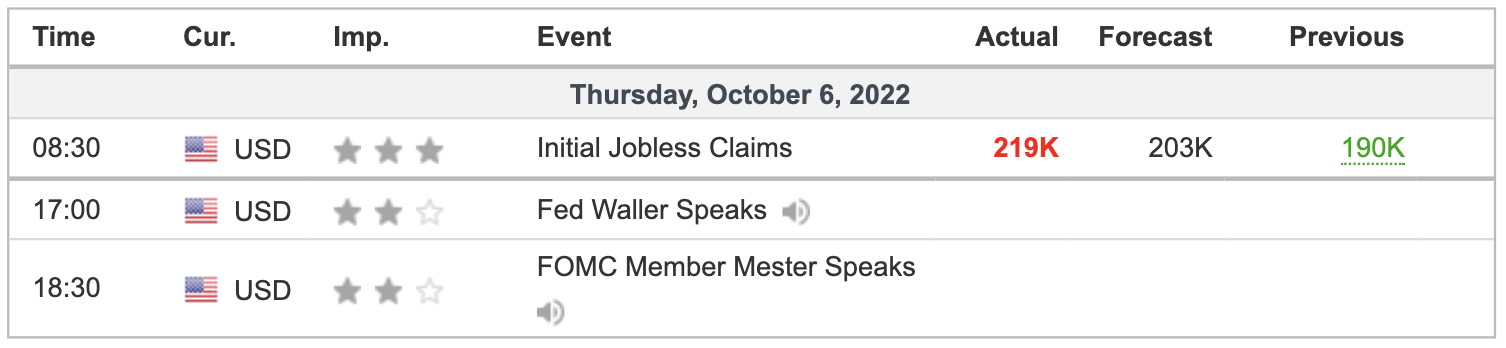
Jobs report is due up tomorrow.
Follow @MrTopStep and @BretKenwell on Twitter and please share if you find our work valuable.
Don’t Forget: We recently noted the long-term performance of the S&P 500 (and what that means for investors and traders), and we also took a look at some longer-term setups for those interested.
Our View
The best way to describe yesterday’s trade is: “False start.”
When the ES started selling off, the bears came out of the woodwork (including me) and the longs got shaken out. When the ES rallied, the shorts got taken out. When you look at it, it was actually a beautiful display of weak hands vs. strong hands.
It’s kind of crazy; Lowery’s had several 8- and 9-to-1 down days in a short span, then there were back-to-back 9-to-1 up days.
I said something about it on Twitter — that the bots have totally taken over. Volume on the ES ladder is less than 40 up at times. A friend that works at an order desk told me they hate taking large ES orders because as soon as the bots see repeated selling they pull their bids and start jumping in front of the offers, and then the liquidity dries up.
He went on to say they try to report the filled order as quickly as they can because the ES moves so fast it could be 20 or 30 points away from the fill. He also said the customers are constantly asking if that is the right fill. The main culprits are the “headline news” algorithmic trading systems or “news algos” which are bombarding the tape all day.
Our Lean — Danny’s Take
If I had to hang my hat on something, I would say the rally that started Sunday night may still have some gas left in the tank. The ES got weak on the close, but part of that was the 1.6B for sale on the MIM.
Our lean is, we think the ES can work higher but can’t rule out some downside raids along the way.
On the upside, I’m watching 3775, then 3792 to 3798. Above 3800 puts 3820 in play, which is the high from yesterday and Globex. The charts below highlight why.
Technical Edge
- NYSE Breadth: 38.4% Upside Volume
- Advance/Decline: 30% Advance
- VIX: ~$29.20
If you missed it, here was a recent setups list for individual stocks.
Game Plan: S&P, Nasdaq, Dollar
The bulls faced some early selling pressure but made a strong stand in the morning. We were looking for support in the 3740 to 3750 area, and while the ES did dip to 3734, it ultimately paid for the “strong hand” bulls, as the ES went on to clear 3800.
Bravo if you cashed.
Now coming into Thursday, the S&P is again under pressure as the dollar tries to push higher. I’m seeing a lower correlation to bonds in the short term and a higher correlation to the dollar, for whatever that’s worth.
Tomorrow is the jobs report, so keep that in mind for today’s action.
S&P 500 — ES

Building above the last week’s high (3751) and the 10-ema, the action looks constructive. But the ES is stuck between a rock and a hard place.
It either needs to push higher into the 21-day moving average and the 3850 area or dip into the 10-day and yesterday’s low at 3734. Eventually, one of these two zones needs to break.
If we break lower, 3700 is in play, followed by 3640.
If we break higher, 3900 is in play, followed by 3920 and 3950.
ES — The Trade

So far, we’re struggling with the 3775-ish area this morning and the declining 10-ema on the 30-min chart. The 30-min is my favorite if that’s worth anything.
If we break the Globex low this morning, look for a possible tag of last week’s low near 3750, and possibly even yesterday’s low of 3734. How the latter is handled (if tested) will say a lot about the current rally and whether it’s near its last breath or still has legs.
On the upside, 3792 to 3798 is the next upside zone I have mapped and above 3800 we face 3820-ish.
If we get a quick push up to the latter (3820) — which was yesterday’s high and the Globex high — I’m looking to initially sell the move.
SPY

Right now, $372.50 is acting as a notable pivot — again. This was support in July, resistance in late September and now again acting as support.
#KISS — bulls want to see the SPY holding the 10-day and $372.50.
Below it puts yesterday’s low in play at $370.95. Below that opens the door down to the $365 to $368 area, which is the 50% to 61.8% retracement window of this week’s rally.
On the upside, let’s see how the 21-day is handled. Above it opens the door to $390.
Dollar — UUP

The dollar is a tricky trade right now.
On Monday, UUP closed on its lows, but then went daily-up out of a support area and filled the gap.
So again, we’re stuck waiting. Does it push higher and clear Tuesday’s high to push back above $30 and clear its short-term moving averages? Or was the gap-fill a “job well done” and we head lower back to larger support?
Time will tell, but keep this chart in mind.
Nasdaq — NQ

Need to see 11,500 continue to hold as support and need to clear and hold 11,675 to 11,700.
Above puts 11,775 and the 21-day in play.
A break of 11,500 and failure to reclaim puts 11,350-ish on the table.
Go-To Watchlist
*Feel free to build your own trades off these relative strength leaders*
- Numbered are the ones I’m watching most closely.
- Bold are the trades with recent updates.
- Italics show means the trade is closed.
Notes:
MCK — weekly-up triggered from our buy list. $360 to $362 is our first upside target. $346 is a reasonable stop-loss for those long from the weekly-up level of $351.
Relative strength leaders →
Top:
- LNG — nearing the breakout near $150 — Monster Reaction
- MCK — holding the breakout near $340
- CAH — holding the breakout near $64
Here’s a quick look at the stocks above (in the Opening Print Twitter Community).
- FSLR
- ALB
- VRTX
- CYTK
- CELH
Economic Calendar
Comments are closed