
Market Review
Taylor 3 Day Cycle
Author: David D Dube (a.k.a. PTGDavid)
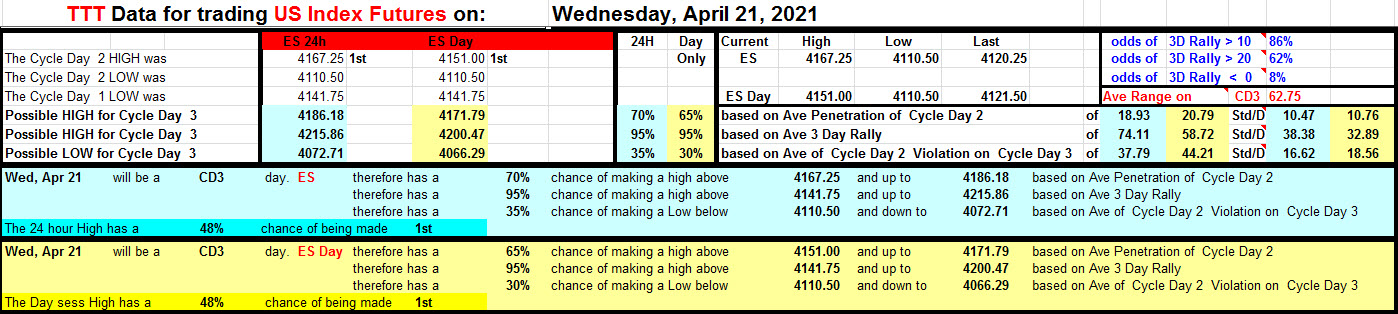
Tuesday’s Session was Cycle Day 2 (CD2): Price violated CD1 Low (4141.75) with a continuation trend lower during RTH fulfilling 4115, “down-range” objective. Range was 56.75 handles on 1.661M contracts exchanged.
…Transition from Cycle Day 2 to Cycle Day 3
This leads us into Cycle Day 3 (CD3): Price is currently well below CD1 Low (4141.75) and typically has strong odds of recovering this level during Cycle Day 3 trading. Failure to recover would be marked as a “Statistical Cycle Failure” which only occurs 9% of the time tracked over twelve years of data. As such estimated scenarios to consider for today’s trading.
1.) Price sustains a bid above 4123, initially targets 4137 – 4142 zone.
2.) Price sustains an offer below 4123, initially targets 4110 – 4103 zone.
*****3 Day Cycle has a 91% probability of fulfilling Positive Cycle Statistic covering 12 years of recorded tracking history.
For more detailed information for both bullish and bearish projected targets, please visit: PTG 3 Day Cycle and/or reference the Cycle Spreadsheet below:
Link to access full Cycle Spreadsheet >> Cycle Day 3 (CD3)
Thank you for reading, PTGDavid
Economic Calendar


Closing Prices

In the TradeChat Room
Market On Close – MiM

Check out all the Market Closing action in our daily post
Questions? Please email me: Marlin@mrtopstep.com
Get the skinny when we get it: Join the MiM.
SpyGate: Chasing the Bots

Checkout our Daily SpyGate Post
SpyGate is now available free to members of IMPRO and MIM trading room. Join the MiM.
Chart of the Day
GMTT / Chart of the Day / Wheat (MAY) / April 21, 2021

Wheat(MAY)
Prices for commodities including wheat, corn, soybeans and vegetable oils have all been rallying sharply since mid-2020. Wheat gains on concerns over dry weather in the northern hemisphere. Looking at the overall technical model we see a topping process. The next upside target for Wheat is 710. However, since there is a projected high we are now looking for a good entry-level to go short. It’s either once Wheat gets close to 710 – with a tight buy stop, or when Wheat elects a technical sell signal which is below 642.
Soybeans (MAY)
Here too we are looking at a projected high in Soybeans. The strategy is either too short now at the market with a buy stop at 1502. Alternatively, you can wait till the beans elect their technical sell signal which is below 1443.
GMTT publishes three weekly its GMTT research report covering the following:
Global Indices, VIX, a selection of stocks, Treasury Bond, Commodities, Soft Commodities, Currencies, and Bitcoin.
Sign up for a free 14-day free trial which you can subscribe to through our website:
Our View
Stocks fell again yesterday as the first-quarter earnings season kicked into gear. The ES opened lower on the day, rallied up to its daily high at 4,151 going into 10:00 ET and then sold off down to 4,110.50.
In the chat room I called the low, before the ES rallied back up to 4,128.50 and then sold back down to 4,110.75 late in the day — a quarter point above the prior low — while the MIM showed $550 million to sell.
And here we go again: After the late low, the ES rallied 20 handles up to 4,131. Within a few minutes, the futures dropped more than 10 points down to 4,119.50.
In terms of the ES’s overall tone: Every rally is failing right now. In terms of the day’s overall trade, 1.66 million futures traded, which is 400,000 to 500,000 more than it has been over the last few weeks.
Our view: The ES is not acting right, or should I say the NQ? Either way, there is some profit-taking going on and the markets are overextended. I know some think the S&P is going down — and the PitBull agrees — but I think all it will do is set up a rally to new highs.
Our lean: What happens when the futures close weak? They rally and then sell off again. My guess is today will be similar to yesterday. Lots of sell stops under 4,108.
As we all know, there’s no crystal ball when it comes to trading stocks, options or futures. But the Market Imbalance Meter may be as close as it comes. Knowing how the “Big Money” is placing its bets can give our trading room a big wave to ride — or a warning sign to stay out of the water. Come check it out now, risk free for 30 days.
Danny Riley is a 39-year veteran of the CME trading floor. He ran one of the largest S&P desks on the floor of the CME Group since 1985.
As always, please use protective buy and sell stops when trading futures and options.
Disclaimer: Trading Futures, Options on Futures, and retail off-exchange foreign currency transactions involves substantial risk of loss and is not suitable for all investors. You should carefully consider whether trading is suitable for you in light of your circumstances, knowledge, and financial resources. Decisions to purchase or sell as a result of the opinions expressed in the forum will be the full responsibility of the person(s) authorizing such transaction(s). BE ADVISED TO ALWAYS USE PROTECTIVE STOP LOSSES AND ALLOW FOR SLIPPAGE TO MANAGE YOUR TRADE(S) AS AN INVESTOR COULD LOSE ALL OR MORE THAN THEIR INITIAL INVESTMENT. PAST PERFORMANCE IS NOT INDICATIVE OF FUTURE RESULTS
No responses yet