
Market Review
GLOBEX
| (ESH20:CME) GLOBEX Session | (ESH20:CME) Day Session |
| High 3582.50 | Opening Print: 3575.50 |
| Low: 3544.00 | High 3577.50 |
| Volume: 180K | Low: 3542.25 |
| ES Settlement 3543.50 | |
| Total Volume 1.3M |
S&P 500 Futures Recap

S&P 500 Futures: Down 8 of the Last 12 Weeks
After trading in a 38.50 handle overnight range, the S&P 500 futures opened Friday’s cash session at 3575.50, up two ticks, and traded to the daily high in the first fifteen minutes at 3577.50. From there, the ES would trade within a range for the rest of the morning making a 3562.00 low, and then remain in that range through the noon hour into the mid-afternoon when the S&Ps began to sell after 1:30 and push down to the 3542.75 low in the closing minutes before settling at 3543.50, down 36.50 handles or -0.96%.
In terms of volume, it was another modest day with 1.3 million contracts traded. In terms of the ESs overall price action, it was another day of ‘failed rallies’.
Economic Calendar

Closing Prices

In the Tradechat Room
MiM


Friday was OPEX, we should see some remnants on the MOO this morning. There was no real lean on the 15:50 candle on Friday but prices were driven up into the reveal and a nice sell-off worth 20 points into the close.
Questions? Please email me: Marlin@mrtopstep.com
Get the skinny when we get it: Join the MiM.
Covid Corner:


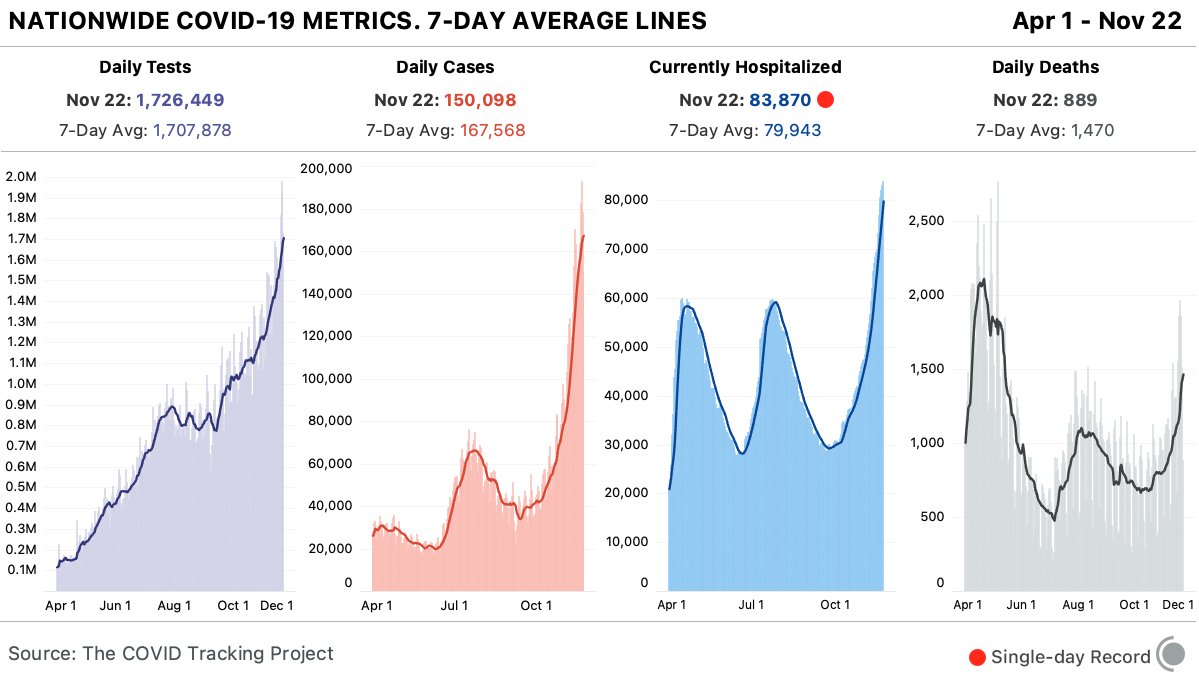
Some states are putting in a decent top and daily cases are starting to flatten out for the USA, or are at least showing slower growth. Hospitalizations are at a max but they are more dispersed geographically than in phase one and two.
More data can be found at: https://covidtracking.com
Wear your masks!
Stay home!
Take your Vitamin D!
Chart of the Day
GMTT – Chart of the Day – Crude – Nov 23, 2020
Crude (JAN)
Earlier this month we posted our Crude forecast where we went long Crude at 33.80.
That position was closed on Nov 12th at 41.50 with a twenty percent profit.
We then stood aside, and needed an intraday close above 42.70 to go long again,
We are now long Crude and get two short term upside targets: 43.90, then followed by 46.15.
The suggested sell stop is 42.15
However, the buy signal only gets cancelled on a close below 40.35.
Nat Gas which was our chart of the day from Nov 16 gave a ten percent profit on the trade in just a few trading days.
The trade was Long Nat Gas (DEC) from 2.92 and the low on Thursday 2.59
Please note: the Natural Gas contract rolled over on Nov 22, 2020 to the Jan 21 contract and that we closed the position.
We offer a free 14-day trial to the Global Macro Technical Report which is published three weekly.
The report covers: Global Indices, Stocks, Bonds, Commodities, Soft Commodities, Currencies, and Bitcoin.
For more info and how to sign up for the free trial visit our website:

Bonus Chart of the Day

Our View
Positive Historical Stats Point to Higher Prices
I am a big believer of the Stock Trader’s Almanac and all its historical stats. PitBull started talking about historical stats just after I started doing his S&Ps. I must admit I was suspicious in the beginning but over a few years, he had me hooked. Bottom line, there are good and bad seasons for the stock market. I’ll say this as plainly as I can, the stats work but COVID19 did mess up some historical norms. That said, the markets always have a way of healing and what better time could that be than the Thanksgiving Holiday week with the S&P down (as the title says) 8 of the last 12 weeks. How often do you see that? Historically, Tuesday and Wednesday are bullish days and the markets are closed on Thursday and only open for half a day on Friday. Volume is going to fall and… thin to win will take over. I’m not saying the S&P is going to go straight up without any hiccups but I think as people back away from their screens and volumes drop there could be a ‘holiday short-covering rally’.
Our view, most of you already know I am a bull market guy, I love buying when everyone is puking and I get paid fast when I’m right. That said, I have mentioned a few times over the last several weeks that the markets have a ‘strange’ feeling to them and I still think that. Barring a few wayward headlines, things should get quieter as the week rolls on. We all know how this has been working, sell off after the open, make a 10:30 -11:00 low, rally up to new highs then… fail. My guess is this pattern changes today or tomorrow to a steady/choppy grain higher. If I’m wrong, 3520 then 3490-3480. If I’m right, 3590 to 3610 and above there 3630.
As always, please use protective buy and sell stops when trading futures and options.
Disclaimer: Trading Futures, Options on Futures, and retail off-exchange foreign currency transactions involves substantial risk of loss and is not suitable for all investors. You should carefully consider whether trading is suitable for you in light of your circumstances, knowledge, and financial resources. Decisions to purchase or sell as a result of the opinions expressed in the forum will be the full responsibility of the person(s) authorizing such transaction(s). BE ADVISED TO ALWAYS USE PROTECTIVE STOP LOSSES AND ALLOW FOR SLIPPAGE TO MANAGE YOUR TRADE(S) AS AN INVESTOR COULD LOSE ALL OR MORE THAN THEIR INITIAL INVESTMENT. PAST PERFORMANCE IS NOT INDICATIVE OF FUTURE RESULTS.
No responses yet