Use AI-Driven Rally to Reposition For Worst Months
Indices are gaining amid weakening breadth
Follow @MrTopStep and @BretKenwell on Twitter and please share if you find our work valuable.
*Please enjoy today’s guest post featuring insight from Jeff Hirsch, who runs Stock Trader’s Almanac. You have heard us reference Jeff’s work many times over the years and there’s a reason for that…his research is fantastic!*
My View
I still maintain my overall bullish outlook for the full year of 2023 calling for 10-15% gains by year-end. But since my April 25 Best Six Months MACD Seasonal Sell Signal for DJIA and S&P 500, we have been shifting to a neutral stance, repositioning for the Worst Months. June is the last month of NASDAQ’s Best 8 Months.
AI and the chip stocks are driving the NASDAQ higher during this last leg of the NASDAQ’s Best 8 months (November-June). For us, AI also stands for Almanac Investor. It is a testament to our seasonal stock screening process that we uncovered Super Micro Computer, Inc. (SMCI) in last November’s stock basket, which is riding the AI wave. As of the May 30 close, SMCI is up 185.7% from our buy price and it’s up 151.0% in the last 5 weeks.
While we hope you are all enjoying this AI/Chip-driven rally, the backdrop over the market remains cautious and still sets up for further sideways action and a likely pullback or correction over the weak summer months, especially after mid-July into the worst two months of the year — August and September.

I have created a new NASDAQ’s seasonal pattern chart here that compares the one-year pattern of all NASDAQ years from 1971-2022 with pre-election years along with our STA Aggregate Cycle which is a combination of all years, pre-election years and years ending in three. So far in 2023 NASDAQ is closely tracking the pre-election pattern, up 24.3% year-to-date.
All three pattern lines show a distinct mid-July peak and then sideways action through late October before the usual pre-election Q4 strength that often brings annual highs and perhaps even new all-time highs. This is lining up well for our NASDAQ Best 8 Months MACD Seasonal Sell Signal that can occur anytime on or after June 1. Almanac Investor subscribers are emailed when it triggers. This NASDAQ rally is also providing us ample time to reposition our portfolio for the Worst 4 months of the year (July-October).
My Lean
The debt ceiling deal is close to being done, but it can still get derailed. I don’t see that happening, but until Biden signs it, I will keep the champagne corked. There could be some sell-on-the-news reactions once it’s signed. We don’t expect the same degree of market fallout this year since we all saw this movie in 2011. Unless there really is an impasse and there is no deal. If that were to transpire, our worst-case scenario might come into play. But for now, expect a deal to occur just in time and the market to mark time until September/October before moving significantly higher.
In the meantime, investors and traders are still handicapping the Fed’s next moves which is 60/40 on a hike at the June FOMC meeting as of this writing. There is also still plenty of recession fear mongering. We don’t see it. The reliable Atlanta Fed’s GDPNow model’s latest estimate for Q2 GDP is 1.9%. Many economists and Fed speakers continue to warn about inflation being persistent. All the inflation metrics we see are trending lower. And we contend we had our recession with the two negative quarters of GDP in 2022 Q1-2.
Another concern for the near term is market internals. Market breadth has been uninspiring as new highs are not expanding while new lows continue to pop up and remain elevated. As the market has drifted sideways over the past month, the A/D Line has made lower highs and is trending down. This suggests that stocks in general are running out of steam.
On a short-term seasonal note, the market has been weaker after Memorial Day in recent years. Starting in 1996 the week after Memorial Day performance diminished.
-
DJIA was up only 40.7% of times, average loss 0.02%, down 9 of last 13.
-
S&P, NAS & R2K all gained ground less than 56% of the time, down 7 of last 13.
-
Huge gains during the week in 2000 skew the averages.
-
My lean is to trade the 3800-4200 range with near term support around 4050 still holding. NASDAQ and big tech may be rallying, but the rest of the market seems tired. As the NASDAQ’s Best 8 months comes to a close in June and the current AI/chip craze fades, we expect seasonality along with the debt ceiling and economic headwinds to prevail and keep a lid on stocks through the summer doldrums.
If we break out significantly above S&P 4200, l could see us running up to 4300 but pull back from there right in time for the mid-July seasonal NASDAQ peak.
MiM and Daily Recap
The ES traded up to 4243 on Globex and opened Monday’s regular session at 4233. After the open, the ES rallied up to 4238.50 and then sold off down to 4216.50 at 10:04. After the low, the ES rallied up to 4232.75 at 10:23, sold off down to a lower low at 4214.25 at 10:30 and then back-and-filled below the VWAP between 4217 and 4223.50 for the next 45 minutes, then flunked down to a new low at 4209.50 at 11:22.
From there, it rallied up to 4222.75, back-and-filled for the next hour and ten minutes and then sold off down to a new low at 4207.50 at 12:43, chopped, then dropped down to 4202.75, up-ticked and then sold off down to the big figure at 4200.00 at 2:10 and then ripped 22.5 points up to 4222.50 at 2:46. The ES then dipped down to 4210.50 at 3:18 and then rallied back up to 4218.50 as the early imbalance showed $344 million to sell.
The ES traded 4216.50 as the 3:50 cash imbalance showed $670 million to sell and traded 4215 on the 4:00 cash close. After 4:00, the ES rallied slightly, then fell and settled at 4213.75 on the 5:00 futures close, up 1.75% or 0.04% on the day.
In the end, you did good if you sold the rallies until later in the day. Buying the dips worked for scalpers. In terms of the ES’s overall tone, it was weaker, but not overly weak. In terms of the ES’s overall trade, volume was high at 1.91 million contracts traded.

Technical Edge
-
NYSE Breadth: 44% Upside Volume
-
Advance/Decline: 45% Advance
-
VIX: ~$18
With the runaway trade in big tech/AI stocks and the wavering breadth noted in the sections above, it may be prudent to shift to a “wait and see” perspective in the short term.
We were able to use Tuesday’s gap-up open to exit our position in CRM and AMZN. Then we were able to position ourselves in other non-tech related names. While that did not work in our favor for PEP, the idea is that some of that hot tech money will rotate into prior relative strength leaders that are now testing into support.
We’ll see how that pans out and react from there. Let’s look at some levels.
S&P 500 — ES
Faded right from the 4243 area. Pretty notable.
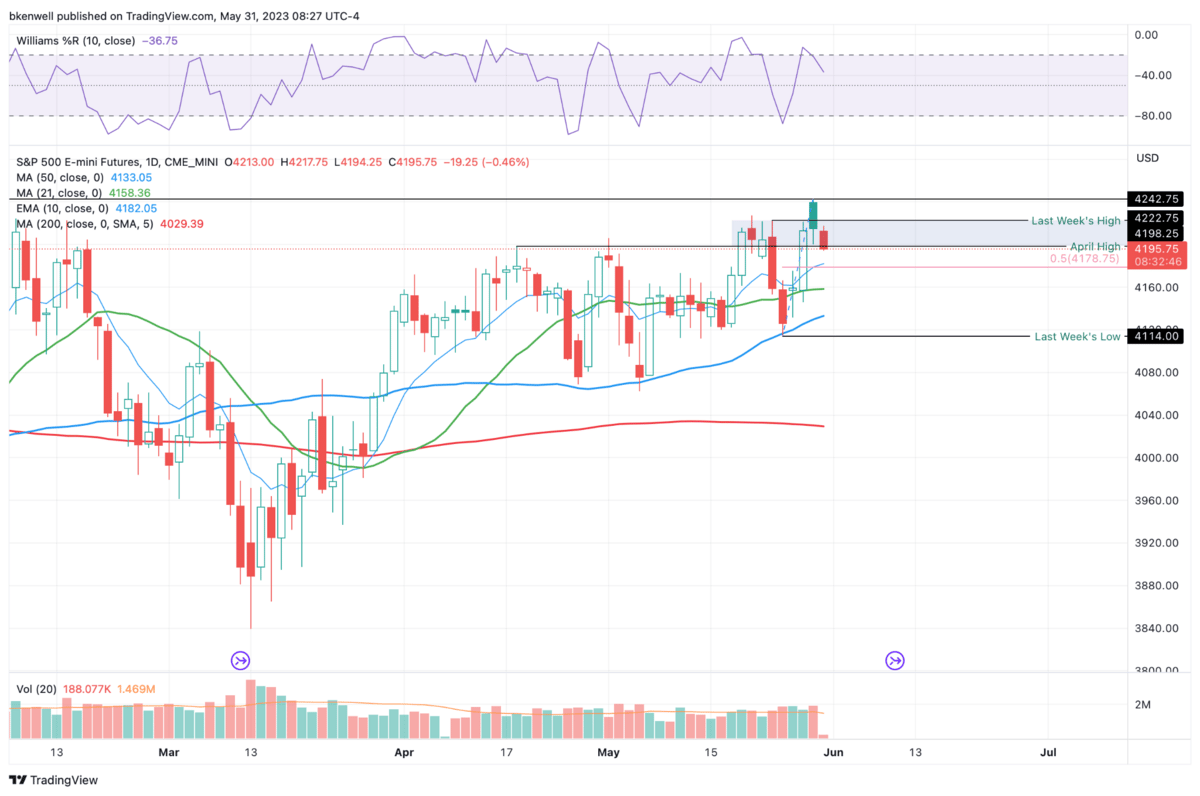
-
Upside Levels: 4215-20, 4242-4250
-
Downside levels: 4200, 4175-80
SPY

-
Upside Levels: $421, $425, $427.50 to $430
-
Downside Levels: ~$418, $415-$416 (prior resistance but also the 50% 61.8% retrace zone of the recent rally)
SPX
-
Upside Levels: 4195-4200, 4230
-
Downside Levels: 4180-85, 4165-67, 4150
NQ
Somewhat of a topping looking stick here for the NQ, as we got a doji on Tuesday and are going daily-down below ~14,337 in Globex. A break of this level could put more digestion in play.
It’s not likely today, but I’m watching the rising 10-day ema and the 50% to 61.8% retracement zone.

QQQ
Same situation in the Qs:

FWIW, the Dow and Russell remain completely uninspiring. It’s clear that tech (and specifically mega-cap tech) are driving the rally right now.
Bold are the trades with recent updates.
Italics show means the trade is closed.
Any positions that get down to ¼ or less (AKA runners) are removed from the list below and left up to you to manage. My only suggestion would be B/E or better stops.)
** = previously mentioned trade setup we are stalking.
Down to Runners in GE, CAH, LLY, ABBV, AAPL, MCD & BRK.B. Now Add META, AVGO and UBER.
-
CRM — Trimmed $207-$208, down to about a 40% position after $212.50 touch. Down to ¼ position at $215-ish, but want runners for potential push to $220.
-
Trim Runners into Tuesday Morning Opening Push (pre-market is fine). Earnings on Wednesday.
-
-
AMZN — Gave us our dip into the $113 range (+/- $1) and then traded $116+ for our first trim. Cleared Tuesday’s high to let us get down to a ½ position as per plan. Trimmed down to ⅓ position at $118+
-
If you didn’t exit on Friday, exit the rest this morning.
-
-
PEP — Long from about $185.50 but not trading well. Nice reaction off the low yesterday. That level — $181.95 — is our hard stop. I would like to see $185-86 to get down to ½ position or get out with a small paper cut.
-
MDLZ — We got the gap-fill and 10-ema/50-day sma tag, but not a good close for MDLZ. Our luck has been good in tech, and not-so-good in “defensive stocks” lately. We’ll see how MDLZ shapes up here.
-
$71 to $71.50-ish is a reasonable stop-loss area
-
-
SBUX — Got us long at $98.90 off the daily-up, but not a good close (especially considering the action in the indices). $96-97 is a reasonable stop. Can do a small trim at $100 if you’d like. Ideally $102-ish is better though.
-
** TLT — I don’t know if we’ll fill the gap at $99.65-ish, but I will get long if we trade the mid-$99s and it holds as support.
Go-To Watchlist
Feel free to build your own trades off these relative strength leaders
Relative strength leaders →
-
MCD, PEP & KO, WMT, PG — group has been faltering, though!
-
LLY, CAH
-
NVDA, SMCI, AMD — anything AI related has been crazy.
-
MSFT, AAPL, META, CRM
-
LULU, CMG, ELF
-
FTNT, AMD
Relative weakness leaders →
-
PYPL
-
MET
-
ONON
-
CF, MOS
-
PFE
-
GLOB
Economic Calendar

Disclaimer: Charts and analysis are for discussion and education purposes only. I am not a financial advisor, do not give financial advice and am not recommending the buying or selling of any security.
Remember: Not all setups will trigger. Not all setups will be profitable. Not all setups should be taken. These are simply the setups that I have put together for years on my own and what I watch as part of my own “game plan” coming into each day. Good luck!
Update your email preferences or unsubscribe here
© The Opening Print
228 Park Ave S, #29976, New York, New York 10003, United States
No responses yet