This post goes out as an email to our subscribers every day and is posted for free here around 2 PM ET. To get your real-time copy, sign up for the free or premium version here: Opening Print Subscribe.
Follow @MrTopStep on Twitter and please share if you find our work valuable!
Our View
Truth or Fiction
One of the traders in the IMPRO shared out this tweet: https://x.com/liderfiscal/status/2046259470007984258?s=20
According to former CIA analyst Larry Johnson, there was an emergency meeting at the White House on Saturday, where Trump tried to use the nuclear codes against Iran, but was stopped by General Dan Caine. The fate of the world depends on eliminating this madman right now!
This is a perfect example of the non-stop disinformation that we see every day… And this one that went with it:
Royal Ambassador @JaokooMoses CONFIRMED: The US Joint Chiefs of Staff Air Force Gen. Dan Caine stormed out of an emergency meeting with Trump. Insiders indicate that Trump wanted to invoke the nuclear codes as a deterrence against Iran but Caine refused and invoked the U.S. Uniform Code of Military Justice.
This was a Twitter account set up in Africa, but it shows how stupid things have gotten and how dangerous the level of false posts has become. I am on something called Threads; it’s owned by Meta, and it doesn’t take a genius to see the level of fake posts. In fact, I used the META AI tool and asked how many fake posts are on Threads, and it said that “every other post” is fake or 50% to 75% are fake, and that 51% of the traffic is AI-generated. META has disabled billions of suspected accounts, and X reports removing or suspending approximately 671 million to 800 million accounts annually for platform manipulation and spam. This figure is actually higher than the platform’s estimated 570 million monthly active users, indicating that “fake” accounts are often caught in waves shortly after creation. With roughly 500 million posts sent per day, even a small percentage of automated activity translates to millions of posts.
Either way, as I have said for years, the public is always sold a bill of goods or disinformation, whether it’s the Fed and its rate cut story, the “AI bubble,” the war in the Middle East, or the story above.
Our View
I copied a story from Michael Wilson from Morgan Stanley about how the corporate earnings recovery had helped the stock market despite the global instability, and I deleted it. I know that so far the earnings have been positive, but on a scale of 1 to 10, the earnings are a 1, and the Middle East conflict and oil are the other 9.
The story about Iran opening the Strait of Hormuz is another headline circle jerk, but the U.S. and Iran plan to hold peace talks in Islamabad. Iran has not publicly confirmed it, but told Pakistan it would send representatives to the meeting. At the same time, President Trump is saying he isn’t inclined to extend the ceasefire deadline that ends Wednesday night.
I think if Trump extends the ceasefire, it will be interpreted as weakness, but as I said, the headlines are all part of the ongoing disinformation that the public sucks up. I’m going to cut this short; it’s been like this every day for the last two weeks.
Our Lean
It’s 10:00 PM, and the PitBull just called me and said, “The ES is up 13 points.” I responded with… so what. I think the US public is dazed and confused about how and when the war is going to end, and just wants it over. I also think, despite Trump’s threat, he desperately wants it over too, but Iran continues to cite Washington’s “excessive demands.”
Our lean: If Iran says it’s willing to meet in Islamabad, the ES and NQ will go up, and Trump will probably back down. If neither happens and oil rises, I think it’s safe to say you can sell the early rallies and buy the pullbacks. Or you can just patiently wait for pullbacks.
I think when there is a real agreement, there will be a real rally, and after that, any decent pullback will get bought. I don’t want to get ahead of myself, but I don’t think it’s outlandish that the ES could rally to 7350 or higher, especially if April closes out the month higher.
And lastly, the support levels I put out yesterday in the lean were 7155 – 7147, 7133, 7120, 7100, 7090, and 7085-83; those should have been the 71 handle. I was not paying attention, but the one level I was actually keying in on was the 7120 level down to 7090 and the 7085 to 7083. Sorry.
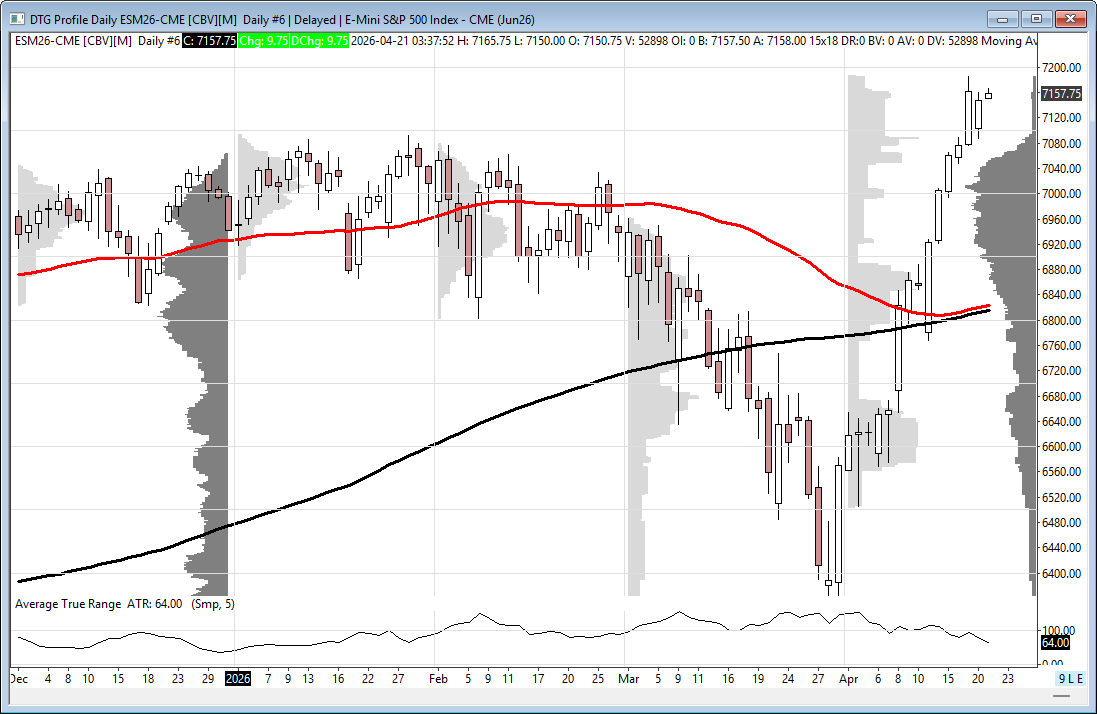
Core Market Profile Indicators
-
Point of Control (POC): The single price level where the most time was spent during a session. It acts as a magnet for price and a key reference for fair value.
-
Value Area (VA): The price range where 70% of the session’s activity occurred.
-
Value Area High (VAH): The upper boundary of the value area.
-
Value Area Low (VAL): The lower boundary of the value area.
-
Single Prints: Areas where price moved so rapidly that only one TPO was recorded. These often indicate institutional rejection at extremes and serve as future support or resistance.
-
Initial Balance (IB): The price range established during the first hour of trading. Breakouts from the IB can signal the day’s likely direction.
-
Naked Point of Control (nPOC): A POC from a previous session that has not yet been “re-touched” by current price action. These are highly significant liquidity zones.
To provide a comprehensive view of the S&P 500 E-Mini Jun ’26 (ESM26) session, I have integrated your specific Core Market Profile Indicators and structural liquidity levels:
Resistance Levels (Upper Targets)
These levels represent potential ceilings where institutional selling or “rejection” often occurs.
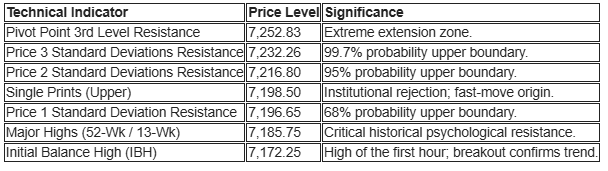
Current Market Context
The “Latest” price relative to the Value Area determines if the market is in an “Expansion” or “Rotation” phase.
-
Latest Price: 7,158.50
-
Value Area High (VAH): 7,150.00 — Current support; breakout above confirms strength.
-
Previous Close: 7,148.00
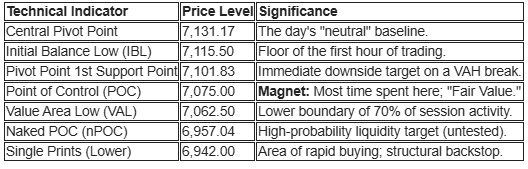
Support & Value-Based Indicators
These levels identify “Fair Value” and areas where buyers typically step in during a pullback.
Strategic Auction Lean
-
Expansion Play: With the Latest Price (7,158.50) holding above the VAH (7,150.00), the market is currently in an “out-of-value” state. If the price remains above the IB high, bulls are looking for a test of the 7,185.75 historical highs.
-
Mean Reversion Play: If the price slips back inside the Value Area (below 7,150), the POC (7,075) becomes a heavy magnet, suggesting a rotation back to the center of the day’s volume.
-
Liquidity Risk: Watch the nPOC (6,957.04). If the market experiences a significant “washout,” this is the most likely destination for price to seek resting liquidity.

Guest Posts:
Tom Incorvia – Blue Tree Strategies
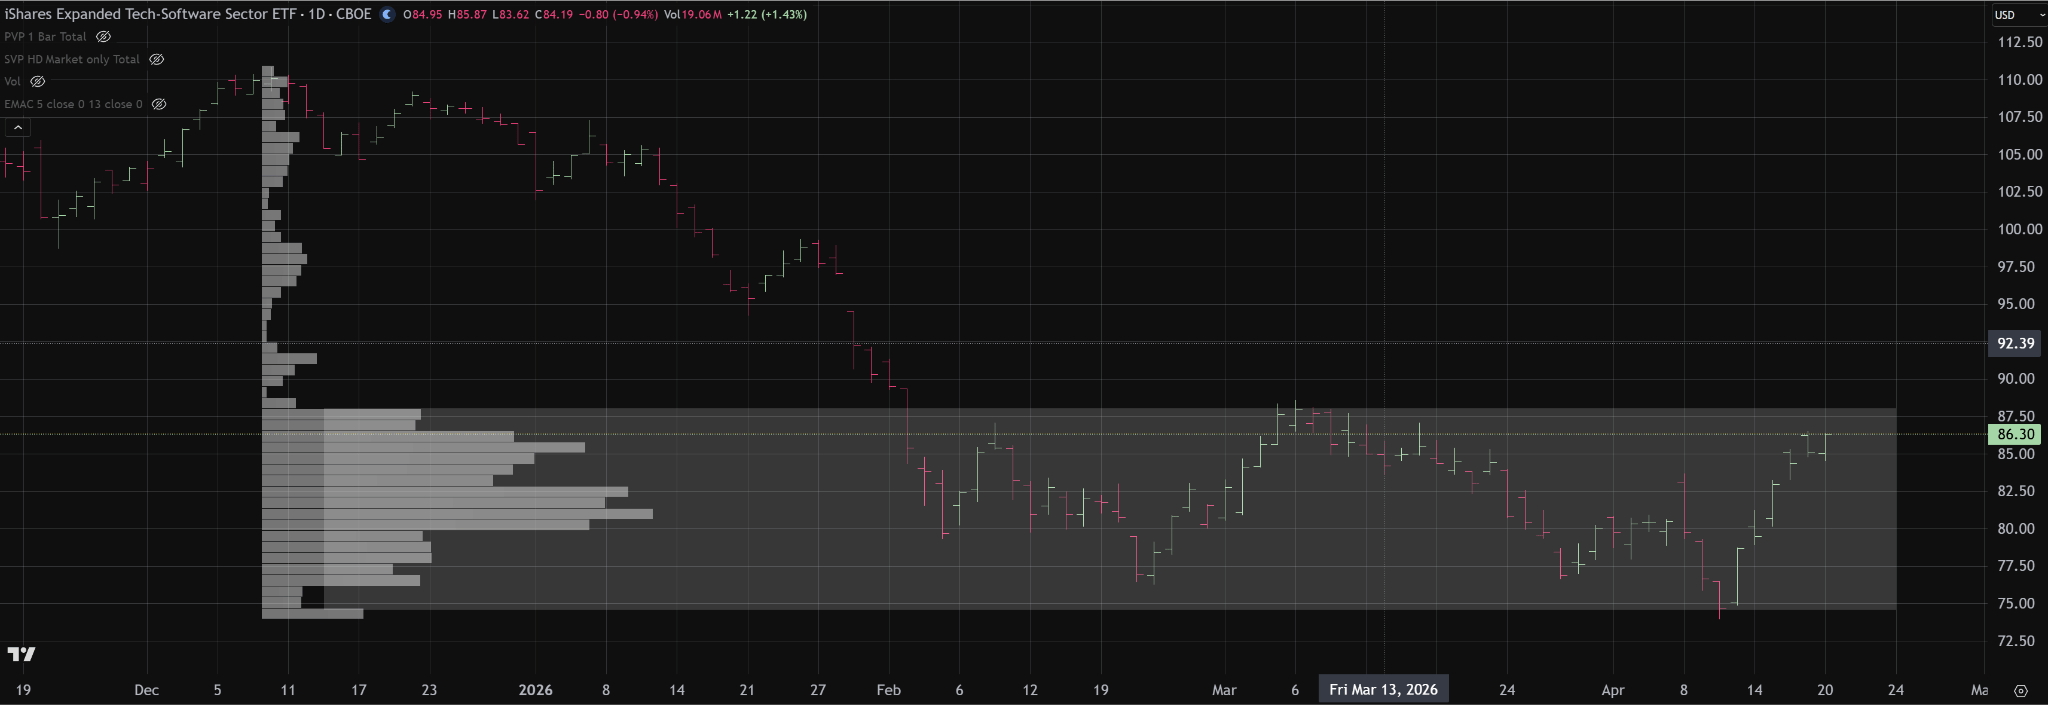
IGV is testing the upper edge of a well-established value area between 75 and 88. Unless price can hold above 88 and build acceptance, this move should still be viewed as a rotation within balance, with risk of returning back through value and potentially toward the lower end of the range near 75.
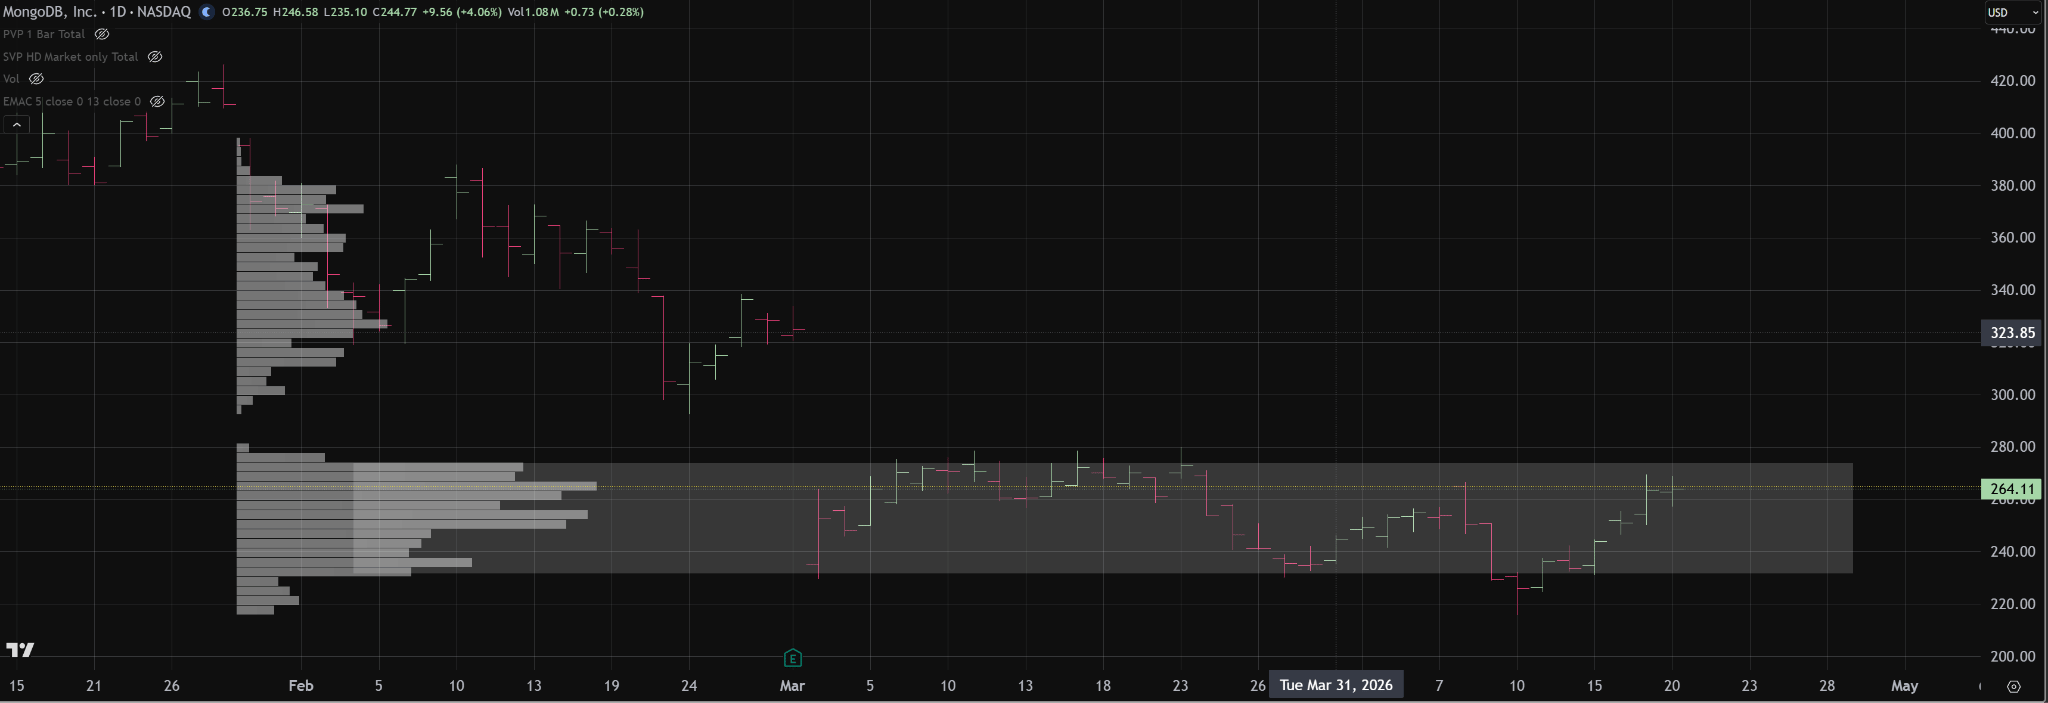
MDB is trading within a well-established area of acceptance between roughly 235 and 275. Price has now rotated back toward the upper half of that balance, putting the market in a decision area. Unless buyers can push above 275 and establish acceptance, this move should still be viewed as a rotation within balance, with risk of returning back through value and potentially toward the lower end of the range near 235.
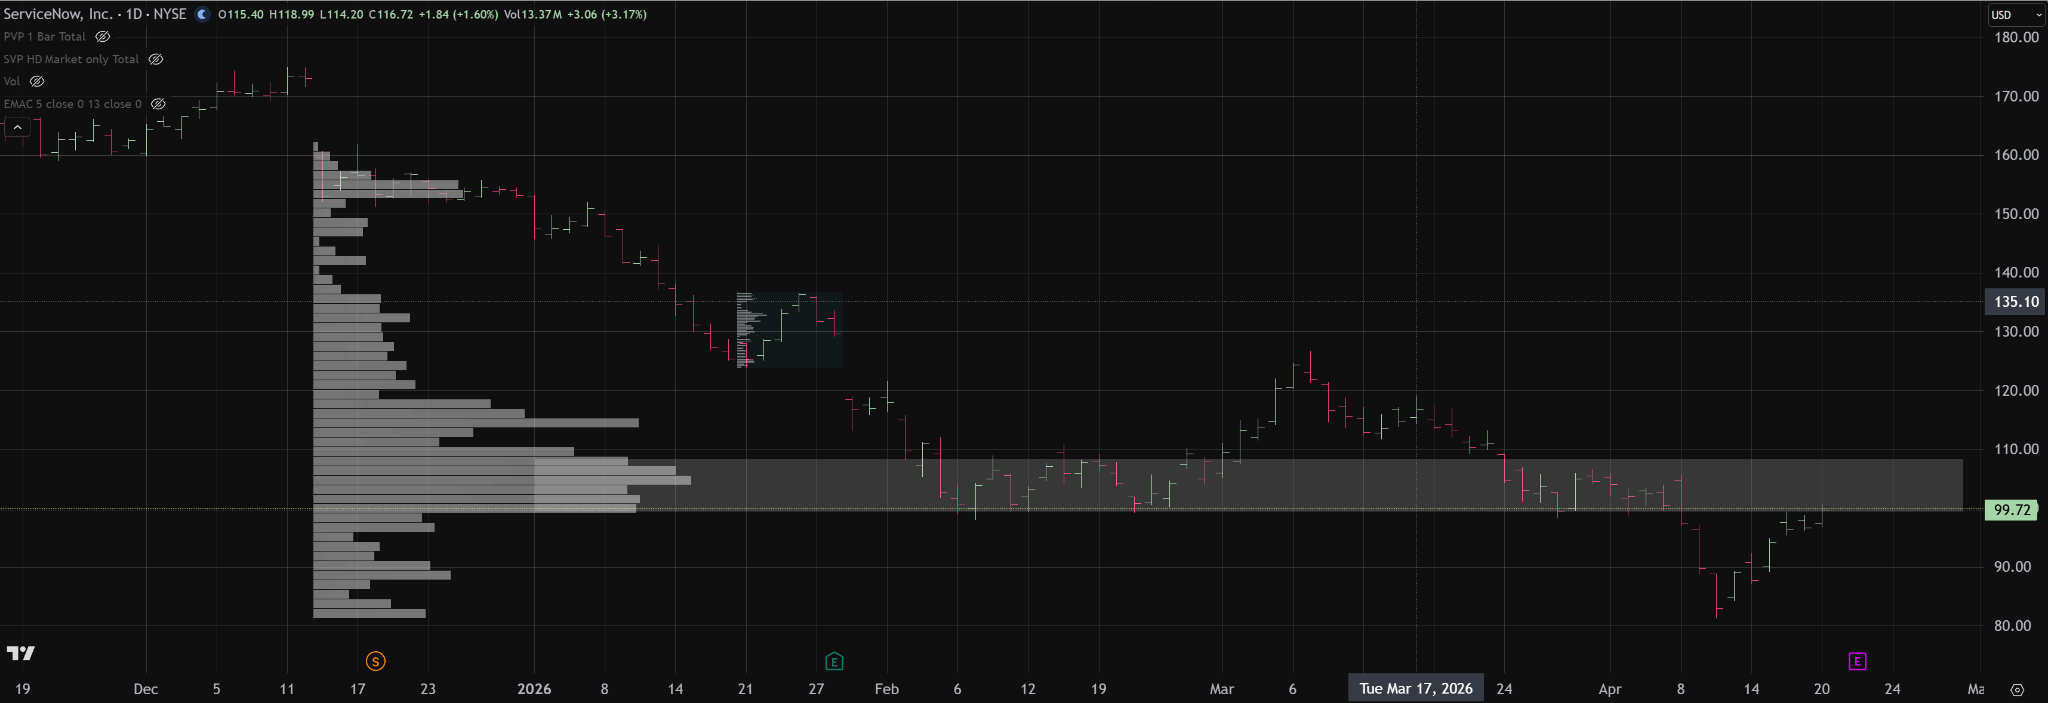
NOW is trading below a major high-volume area roughly between 95 and 108. From an auction perspective, that prior area of heavy acceptance should now be viewed as potential overhead resistance. The key issue is whether buyers can re-enter that area and establish acceptance, or whether the market is rejected from it and remains below value. If price cannot gain acceptance back into that high-volume zone, the rally is likely just a counter-trend move within a weaker auction. Acceptance back into and through that area would be the first sign that the market is repairing the damage and attempting to rebuild value higher.
You can purchase Tom’s Course on Volume Profile here
Market Recap
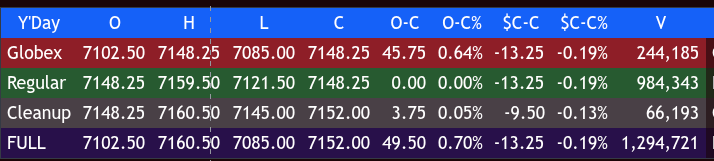
At 9:29 AM, the ES was at its high of 7148.25 and opened Monday’s regular session at 7148.25, down 13.25 points or -0.19%, with 255k contracts traded.
After the open, the ES zigzagged up to 7159.50 at 9:55, then sold off down to 7146.75. It made a sequence of lower highs, and around that time, I posted this:
IMPRO:Dboy:[10:11:45 AM]: feels like it could fall out of bed.
The ES sold off down to 7139.50, rallied up to 7148.25, and sold off 26.75 points down to 7121.50 at 11:05 after this headline hit the tape:
IMPRO:Dboy:[10:52:27 AM]: TRUMP SAYS “HIGHLY UNLIKELY” HE EXTENDS CEASEFIRE WITH IRAN.
After that low, the ES rallied 23.75 points up to 7145.25 at 11:25, did a sideways-to-lower grind down to 7130.25 at 12:15, rallied up to 7141.25 at 12:30, pulled back to 7132.55 at 1:00, and traded up to 7144.25 at 1:20. It then fell into another sideways-to-lower grind down to the VWAP at 7138.00 and traded down to 7135.00 at 2:00, did another round of sideways-to-up back-and-fill, and traded up to 7146.75. It pulled back to 7136.50 at 3:45 and traded 7139.75 as the 3:50 cash imbalance showed $400 million to buy, then started going bid and traded 7148.25 on the 4:00 cash close.
After 4:00, the ES traded 7149.50, traded 7145.00, and then traded up to 7160.50 after a headline hit that Iran reopened the Strait of Hormuz. But Trump came out saying the blockade on Iranian ships and ports will stay in effect, and the ES sold off down to 7151.50 and settled at 7152.00, down 9.50 points or -0.13%.
The NQ settled at 26,774.25, down 51.25 points or -0.19%, the YM settled at 49,693, up 52 points or +0.10%, and the RTY settled at 2,807.60, up 18.70 points or +0.67% on the day.
In the end, this is a very volatile game of geopolitical chess. In terms of the ES’s and NQ’s overall tone, I could see that after they made their early highs, they were running out of gas. In terms of the ES’s overall trade, volume was low at 1.295 million contracts traded.
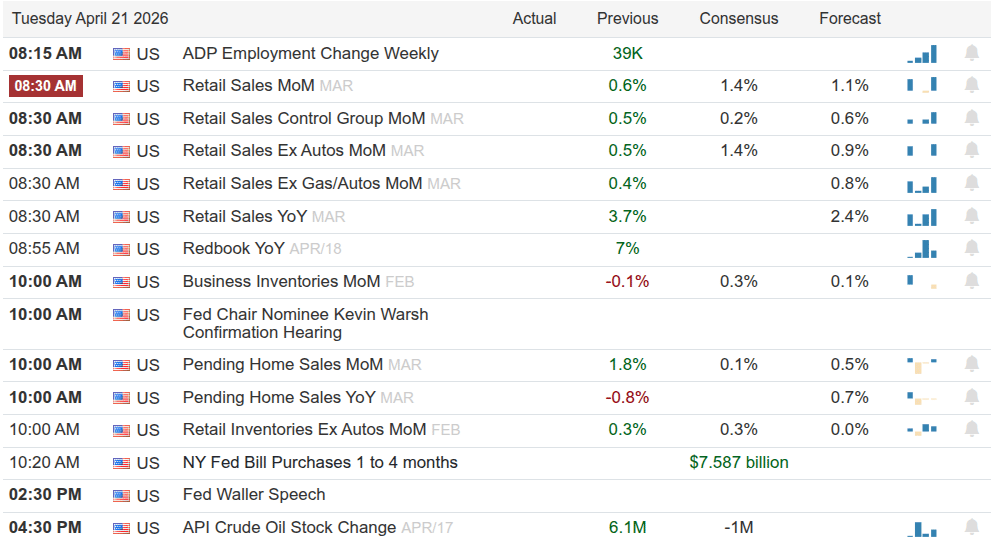
Today’s economic calendar includes Retail Sales at 8:30 and Business Inventories and Pending Home Sales at 10:00.
MiM
Market-on-Close Recap – MiM
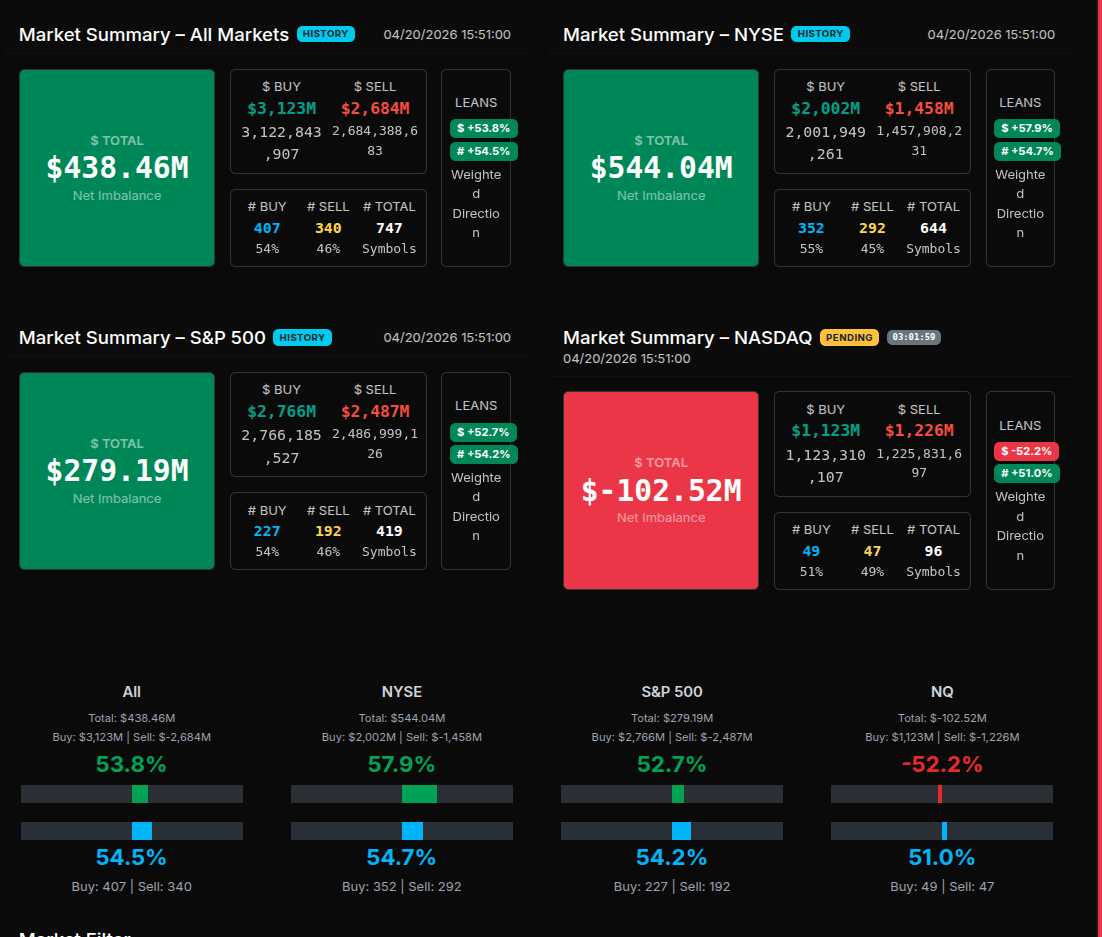
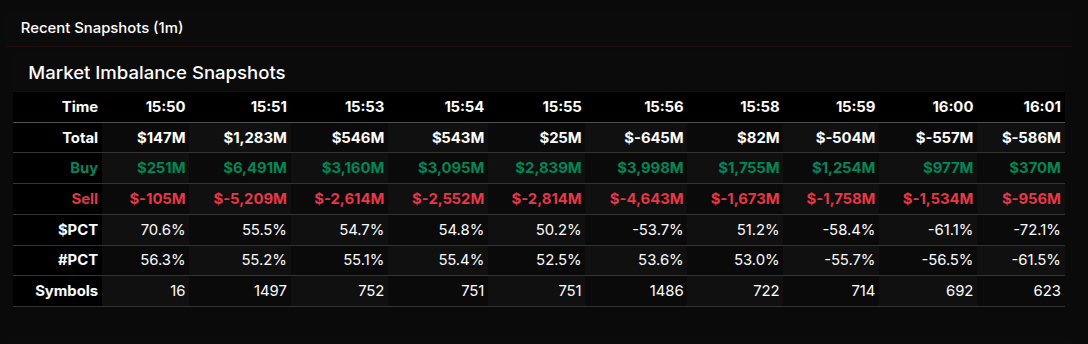
The MOC session opened with a clear buy-side imbalance, but importantly, not at an extreme level. Early snapshots at 15:50 showed +70.6%, and while that indicates directional demand, it sits closer to rotational than wholesale. This was confirmed by the broader market summary showing +53.8% overall and +57.9% on NYSE—firmly positive but not stretched. The S&P 500 echoed this with a +52.7% lean, while Nasdaq diverged slightly at -52.2%, signaling early two-way trade rather than synchronized institutional buying.
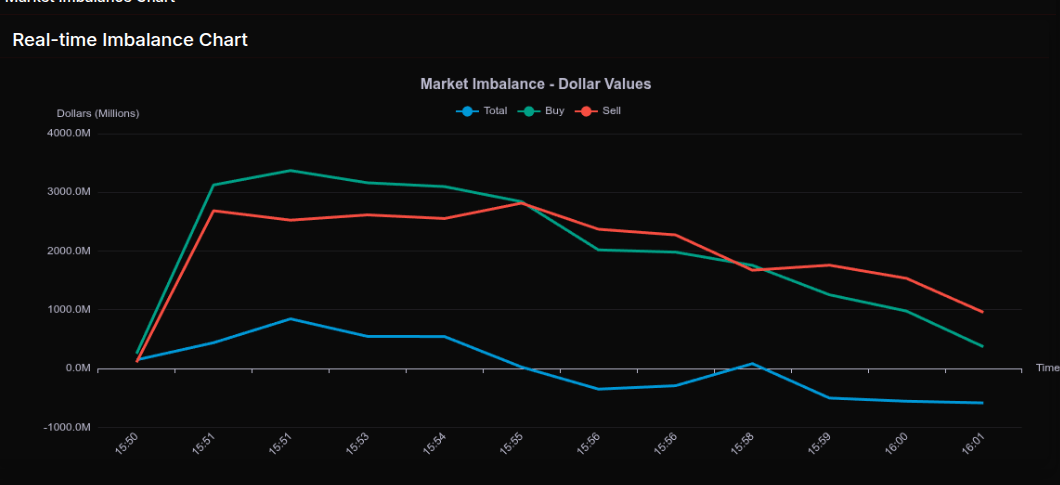
As the auction progressed into 15:51–15:54, buy pressure expanded meaningfully with notional buy programs peaking near $1.2B. However, the percentage leans stayed in the mid-50% range, reinforcing that this was broad participation rather than aggressive one-sided accumulation. This type of structure typically reflects rebalancing or passive flows rather than urgency.
The transition phase began around 15:56, where the imbalance sharply flipped to -53.7% and continued to deteriorate into the close, reaching -72.1% by 16:01. This is a key signal—crossing the -66% threshold indicates a wholesale shift to sell-side dominance. The late ramp in sell programs, particularly with totals moving to -$500M to -$586M, confirms institutions leaning into supply into the bell rather than absorbing it.
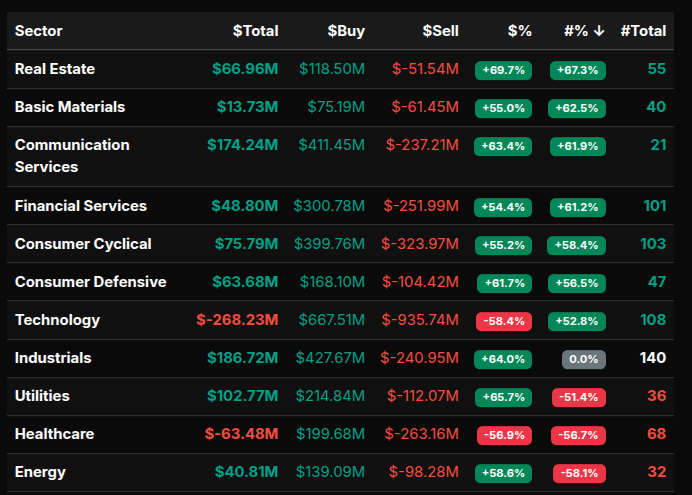
Sector flows were mixed but leaned constructive overall. Industrials (+64%), Utilities (+65.7%), Real Estate (+69.7%), and Communication Services (+63.4%) showed strong buy-side control, though mostly below the extreme threshold. Technology (-58.4%) and Healthcare (-56.9%) stood out as relative laggards, both showing persistent sell pressure, though not quite at capitulation levels.
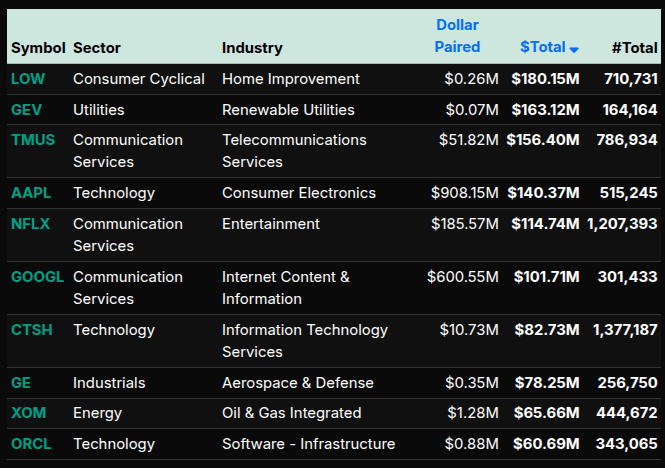
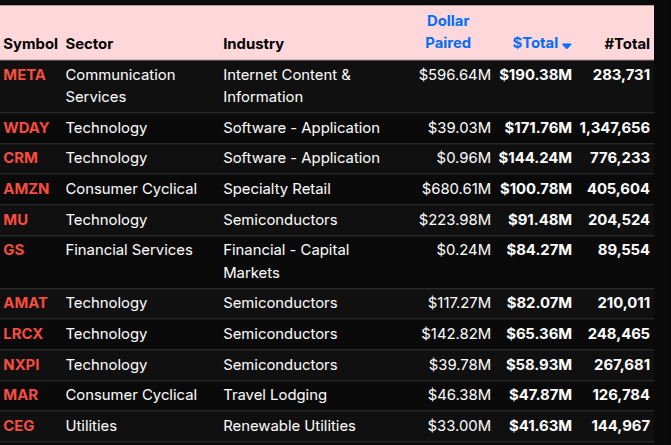
At the symbol level, there was clear dispersion. META (+$190M), AMZN (+$100M), and MU (+$91M) led the buy side, while flows into LOW (+$180M), AAPL (+$140M), and TMUS (+$156M) reinforced participation across sectors. On the sell side, heavy supply concentrated in software and semis, including WDAY, CRM, and AMAT, highlighting rotation out of growth into more defensive or yield-sensitive areas.
Overall, the session evolved from balanced accumulation into a decisive sell imbalance, with the closing print driven by institutional distribution rather than broad-based liquidation.
Technical Edge
Fair Values for April 21, 2026:
-
SP: 35.38
-
NQ: 153.2
-
Dow: 182.01
Daily Market Recap 📊
For Monday, April 20, 2026
-
NYSE Breadth: 55% Upside Volume
-
Nasdaq Breadth: 51% Upside Volume
-
Total Breadth: 52% Upside Volume
-
NYSE Advance/Decline: 54% Advance
-
Nasdaq Advance/Decline: 50% Advance
-
Total Advance/Decline: 51% Advance
-
NYSE New Highs/New Lows: 141 / 11
-
Nasdaq New Highs/New Lows: 297 / 71
-
NYSE TRIN: 0.94
-
Nasdaq TRIN: 0.96
Weekly Breadth Data 📈
For Week Ending Friday, April 17, 2026
-
NYSE Breadth: 66% Upside Volume
-
Nasdaq Breadth: 73% Upside Volume
-
Total Breadth: 70% Upside Volume
-
NYSE Advance/Decline: 76% Advance
-
Nasdaq Advance/Decline: 80% Advance
-
Total Advance/Decline: 79% Advance
-
NYSE New Highs/New Lows: 284 / 59
-
Nasdaq New Highs/New Lows: 710 / 264
-
NYSE TRIN: 1.70
-
Nasdaq TRIN: 1.53
ES & NQ Levels (Premium only)

ES – M26 Levels
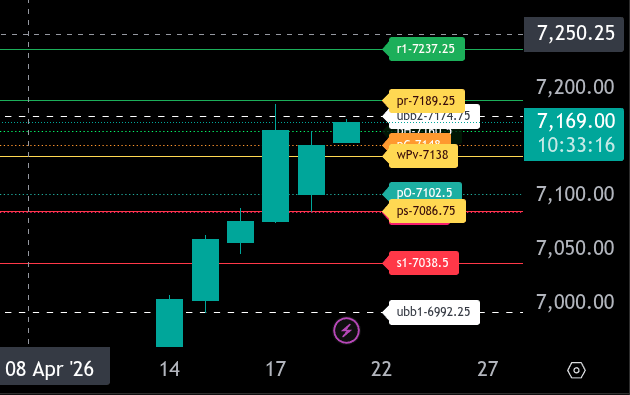
The bull/bear line for the ES is at 7138.00. This remains the key pivot for today’s session. Holding above this level keeps buyers in control, while losing it would shift momentum back to the downside.
Currently, ES is trading around 7169.50, maintaining strength above the bull/bear line. As long as price holds above 7138.00, dips into 7160.50 and 7148.00 can be viewed as potential support zones for continuation higher.
On the upside, resistance comes in at 7174.75, followed by 7189.25, which is the upper range target for today. A break and hold above 7189.25 opens the door for a continuation move toward 7237.25. Acceptance above 7189.25 would confirm sustained bullish momentum.
On the downside, failure to hold 7138.00 puts pressure on the market, targeting 7102.50 and then 7086.75, which is the lower range target. A break below 7086.75 could accelerate selling and extend the move toward 7038.50.
Overall, the market is positioned bullish above 7138.00, with buyers in control while holding this level. Watch for continuation toward 7189.25 and higher, but be prepared for a rotation back into the range if price loses the bull/bear line.
NQ – M26 – Levels
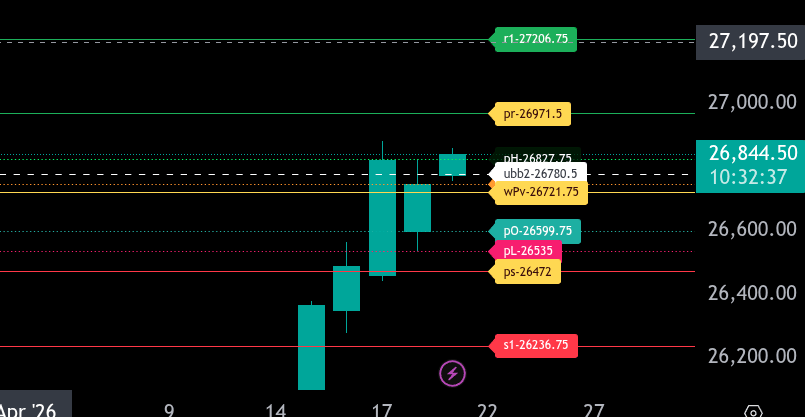
The bull/bear line for the NQ is at 26721.75. This is the key pivot controlling direction. Holding above this level keeps the market in a bullish posture, while acceptance back below shifts momentum to sellers.
NQ is currently trading around 26844.50, maintaining strength above the bull/bear line after a strong impulsive move higher. As long as price holds above 26721.75, dips are likely to be bought, with continuation targeting 26971.50 as the upper range target for today. A break and acceptance above 26971.50 opens the door for a push toward 27206.75.
On the downside, initial support sits at 26827.75, followed by 26780.50 and then the bull/bear line at 26721.75. If price loses this level, expect a rotation lower toward 26599.75 and then 26535. A failure to hold there brings 26472 into play as the lower range target.
Overall, the trend is bullish above 26721.75, with strong upside momentum in play. Sellers need to reclaim and hold below this level to disrupt the current structure and trigger a deeper pullback.
Calendars
Economic Calendar
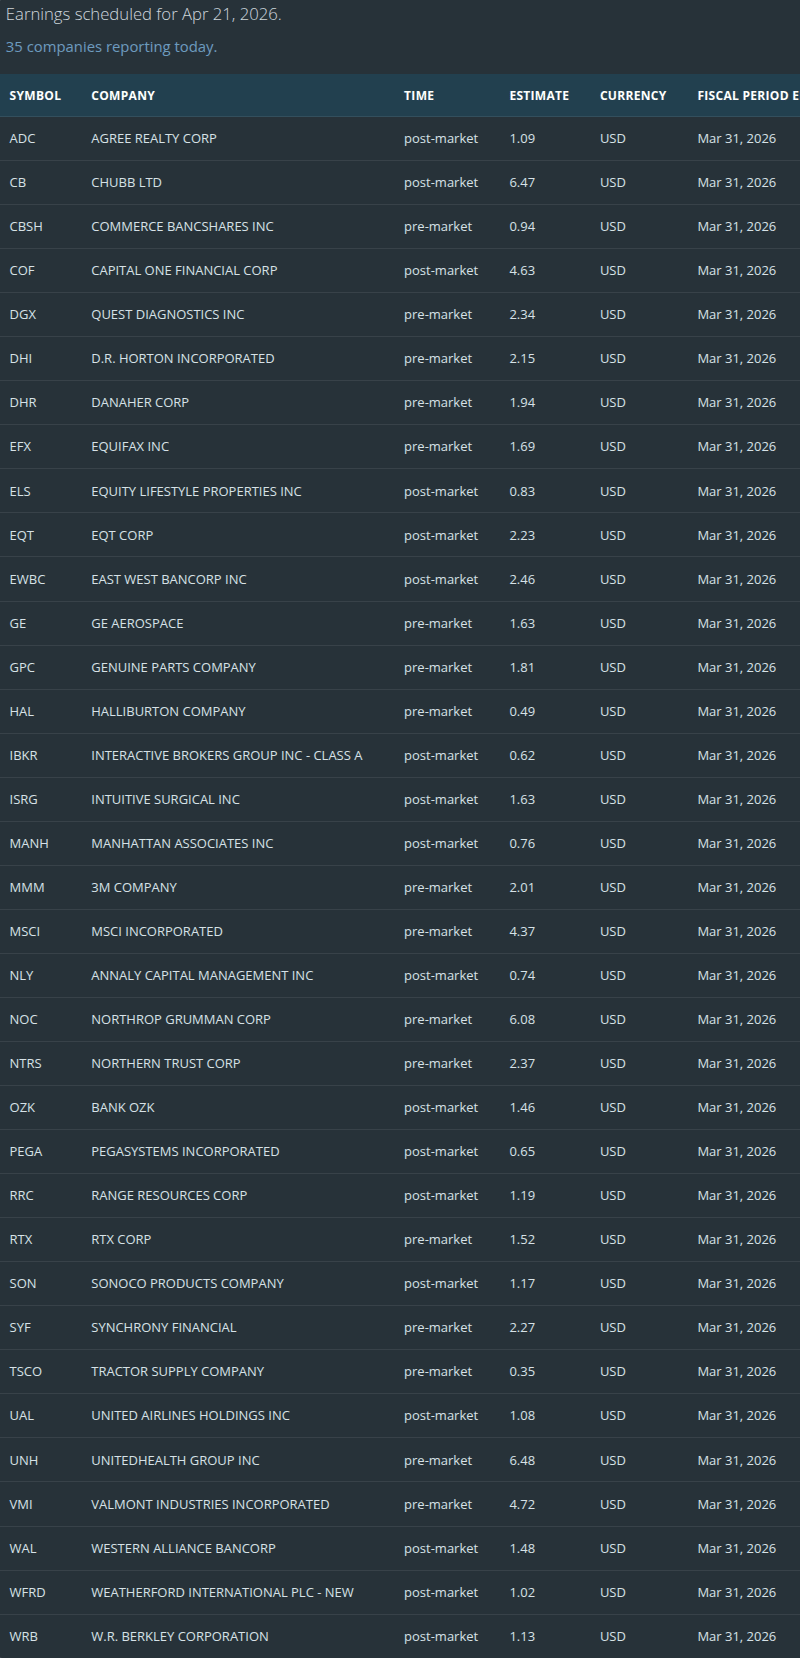
Today’s S&P500 Earnings:
Trading Room Summaries
Polaris Trading Group Summary – Monday, April 20, 2026
The session unfolded almost exactly according to the DTS game plan, reinforcing the importance of preparation and trusting the process.
Morning – Gap Play Executes Cleanly
-
GLOBEX gap down to start the session
-
7115 “Line in the Sand” held as key support
-
Bulls reclaimed 7115, confirming the gap play setup
-
Price pushed to 7135 target, hit early in the session
-
Textbook execution of the gap playbook from the DTS plan
-
Headline risk (Iran news) created a choppy, reactive environment
-
Emphasis from David early: expect noise, stay disciplined
Mid-Morning – Transition to Back & Fill
After the initial push, the market shifted into expected consolidation:
-
Back-and-fill price action between overnight levels
-
Momentum digestion after the extended rally
-
Reinforcement of the idea that not every day is a trend day
The room stayed grounded in context: a 3-day positive cycle (historically strong) but needing to pause and reset.
Trades – Solid Execution with Realistic Outcomes
-
Open Range trades:
-
CL and NQ hit targets
-
ES stopped out
-
-
Net result: 2 out of 3 winners — a solid, professional outcome
Key takeaway: Consistency over perfection. Even when one instrument fails, proper structure across markets keeps the day positive.
Midday – Targets Completed, Discipline Kicks In
By noon:
-
All DTS targets had been fulfilled
-
Market clearly transitioned into low-quality chop
-
David stepped away, modeling an important behavior:
When the edge is gone, step aside.
Afternoon – Chop Fest & Patience
The afternoon confirmed expectations:
-
“Chop fest with traps”
-
Lack of rhythm and follow-through
-
No high-probability setups
The room correctly identified this as a low-opportunity environment, avoiding overtrading.
Closing Phase – No Hero Trades
Into the final 30 minutes:
-
“Dip n Rip or Flunk n Dunk” was discussed, but no clear edge emerged
-
MOC was small and non-informative
-
Day closed in wait-and-see mode
Key Lessons & Takeaways
1. Preparation Pays
The DTS levels and plan nailed the morning trade. This was a textbook example of executing pre-market planning.
2. Take the “Easy Money” Early
The best opportunity came from the gap recovery trade. After that, conditions deteriorated.
3. Accept Market Conditions
Not every day trends. Recognizing back-and-fill days prevents frustration and overtrading.
4. Professional Risk Management
“2 out of 3 ain’t bad” — strong mindset. Losses are part of the system, not a failure.
5. Know When to Stop
Stepping away after targets were hit was one of the best trades of the day.
Looking Ahead
-
Fresh Cycle Day 1 expected next session
-
Potential for renewed momentum after consolidation
Discovery Trading Group Room Preview – Tuesday, April 21, 2026
Macro / Geopolitics
-
Primary driver: escalating US–Iran tensions and upcoming negotiations during the current ceasefire window.
-
Talks expected midweek (ET), but Strait of Hormuz remains unresolved, with the US maintaining a blockade and continued disruptions to shipping.
-
Oil risk elevated: Citi sees $110+ crude if closures persist another month.
-
Spillover effects growing:
-
Higher global flight fuel costs (+$100+/passenger long-haul)
-
EU preparing contingency plans for jet fuel shortages
-
-
China pushing for de-escalation and normalization of shipping flows.
Corporate Spotlight
-
Apple (AAPL): Tim Cook stepping down Sept 1 → succeeded by John Ternus (Head of Hardware Engineering).
-
Stock under pressure on leadership transition.
-
Cook moves to Executive Chairman after major growth era (Services +1000% market cap expansion).
-
Earnings Flow
-
Premarket: MMM, DHI, DHR, GE, NOC, UNH, HAL, RTX, others
-
After close: COF, IBKR, ISRG, UAL, AMX
-
Wednesday AM: BA, T, CME, PM, LUV, VRT, ELV, more
Macro Calendar (ET)
-
8:15 – ADP Employment
-
8:30 – Retail Sales (key)
-
10:00 – Pending Home Sales, Inventories
-
10:00 – Warsh (Fed Chair nominee) hearing
-
2:30 – Waller speaks
Flows / Positioning
-
Whale bias: short into 8:30 Retail Sales
-
Overnight volume lighter than recent sessions
-
Volatility compressed Monday, but headline risk remains high
ES Technicals
-
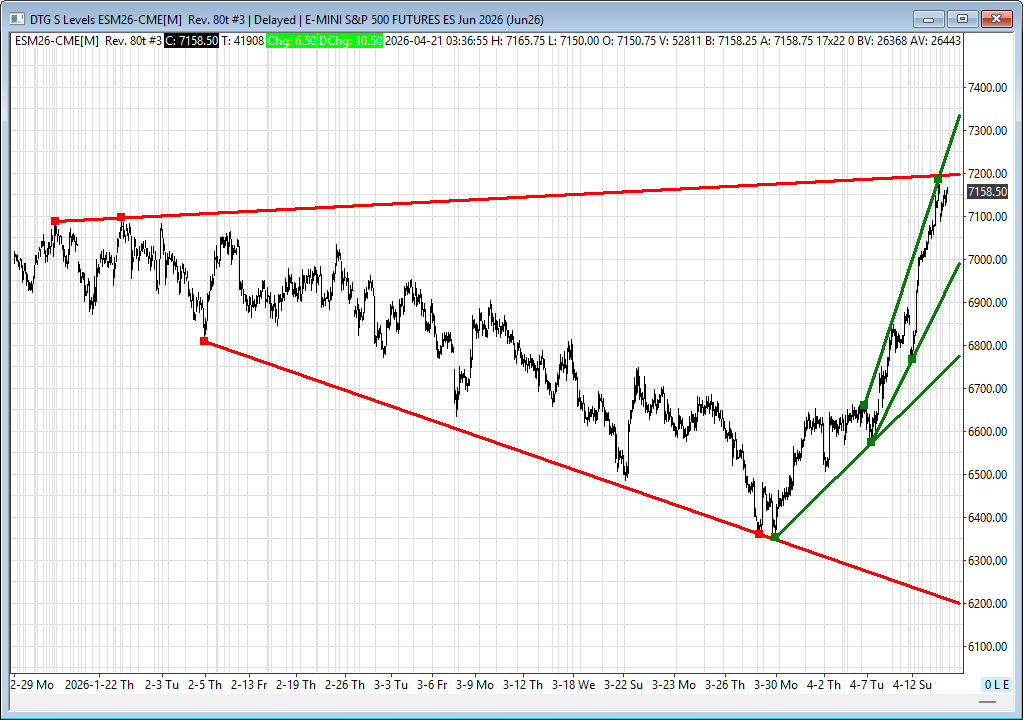
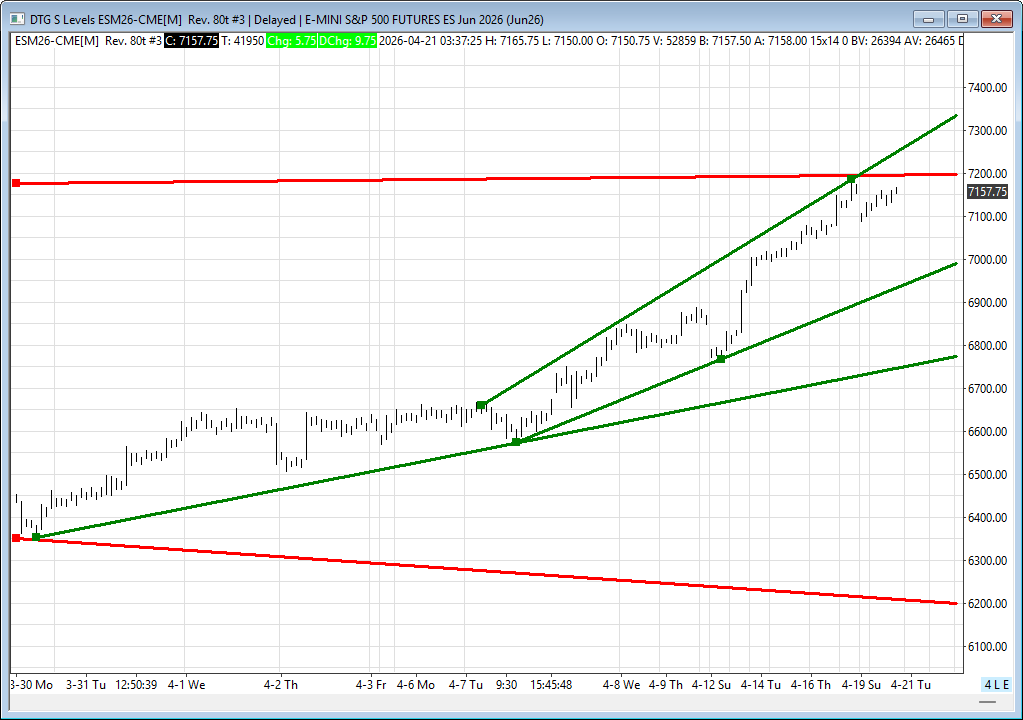
Failed to retest 7197–7202 trendline → remains key resistance
-
Trend still short-term bullish (uptrend channel intact)
-
Bullish MA structure: 50D > 200D and not converging
Key Levels
-
Resistance (TL): 7197–7202, 7297–7302
-
Support (TL): 6969–6974, 6770–6775, 6215–6210
Bottom Line
Markets are balancing geopolitical risk (oil + volatility) with a still-bullish technical backdrop. Near-term direction likely hinges on Retail Sales + Middle East headlines, with sellers leaning in tactically despite the broader uptrend.
Affiliate Disclosure: This newsletter may contain affiliate links, which means we may earn a commission if you click through and make a purchase. This comes at no additional cost to you and helps us continue providing valuable content. We only recommend products or services we genuinely believe in. Thank you for your support!
Disclaimer: Charts and analysis are for discussion and education purposes only. I am not a financial advisor, do not give financial advice and am not recommending the buying or selling of any security.
Remember: Not all setups will trigger. Not all setups will be profitable. Not all setups should be taken. These are simply the setups that I have put together for years on my own and what I watch as part of my own “game plan” coming into each day. Good luck!
This post goes out as an email to our subscribers every day and is posted for free here around 2 PM ET. To get your real-time copy, sign up for the free or premium version here: Opening Print Subscribe.
Comments are closed