Our View — 186 Banks
Over the weekend, UBS initially offered to buy Credit Suisse for $1 billion which was 85% below what it was valued at last week. The price works out to .27 cents a share and basically makes the bank a penny stock. Ultimately, it ended up agreeing to a price just north of $3 billion.
Even more scary, according to SSRM, they analyzed U.S bank exposure to recent rise in interest rates for financial stability. The U.S. banking systems market value is $2 trillion lower than suggested by their book value accounting. I am not going to add to this, but I will include the link of the story for you to read.
There is so much going on that the public doesn’t know about. It’s hard to believe that there won’t be more problems in the coming week and months. What other meltdowns are on the way?
Dollar liquidity, under-capitalized pension funds, and commercial real estate (remember Pimco’s default?) should be on everyone’s radar. I am going to leave it at that. I will be going live via YouTube tomorrow and the link will be posted on Twitter and before I do Bret will send out the link. See you then!
Our Lean
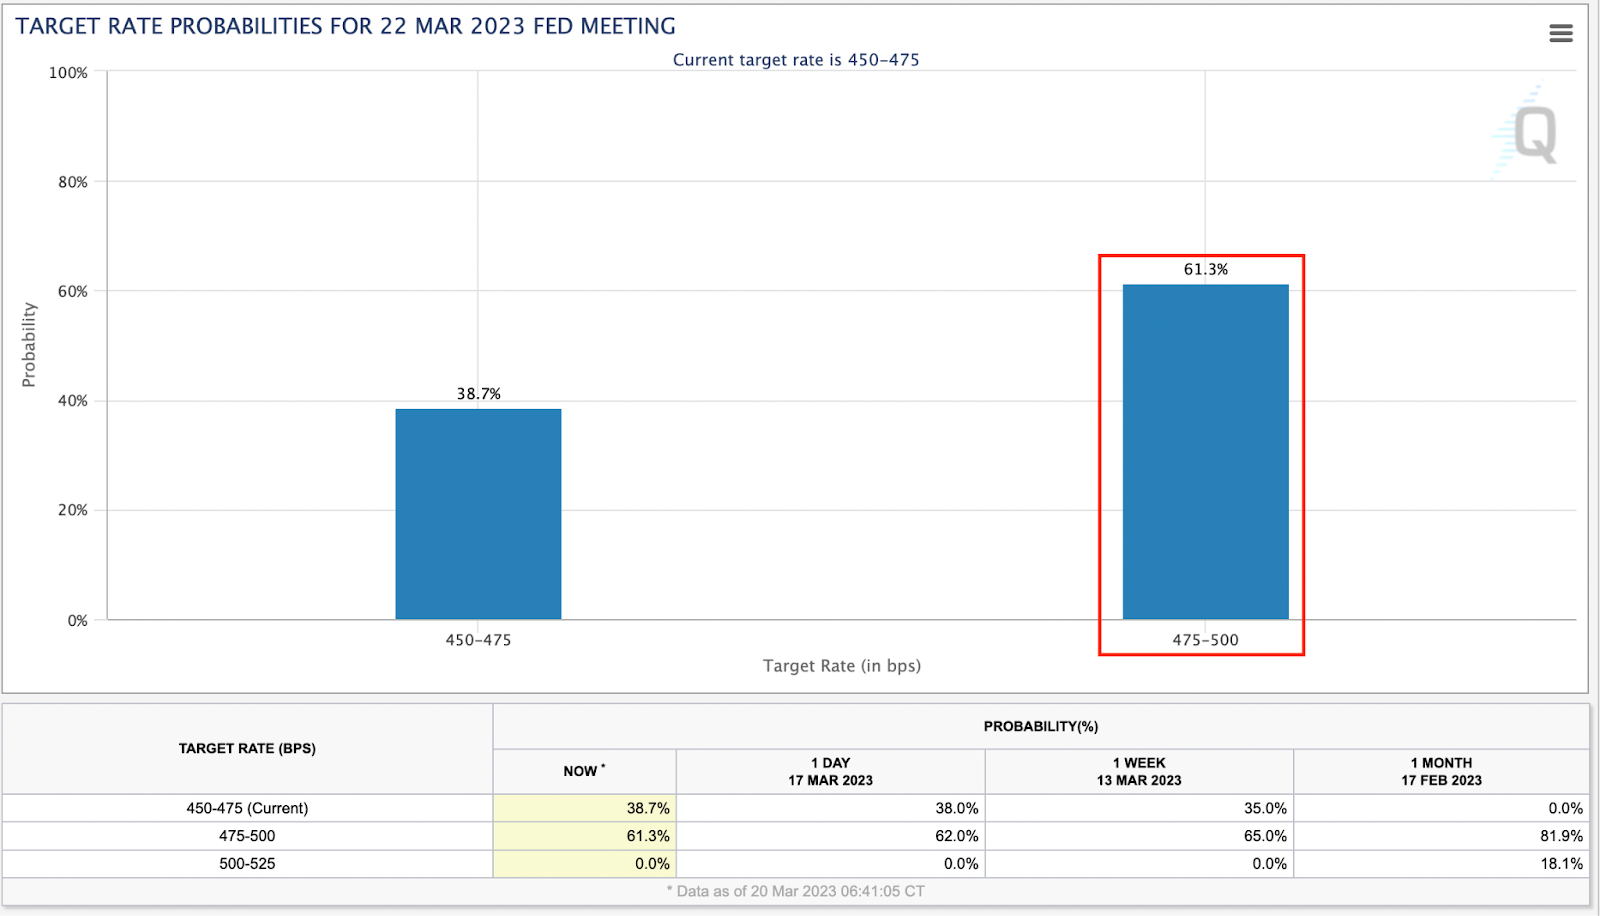
The Fed’s two-day meeting starts Tuesday and I expect a 25 bps rate hike. For now, the market favors a 25 bps hike too, with the odds sitting at about 61%. It’s important to note that a few weeks ago, the consensus was a 50 bps hike.
According to the Stock Trader’s Almanac, the week ending 3/20/2020 was the worst Dow weekly loss and the 2nd worst percentage loss overall, down 4,012 points or down 17.3%. That said, the Dow climbed 12.8% in the following week.
However, history does not favor this week for the bulls.
The week after the Triple Witching has the Dow down 22 of the last 35 occasions (or about 63% on the time). Remember, last week was the Triple Witch.
March is known for mid-month strength, but late-month weakness is most evident. We thought the ES had a good chance to pull back under 3950, which it did, and while the futures have been trying to rally, the ES is having a very hard time holding any of the rallies.
Our Lean is two-fold. First, we cannot rule out more negative bank headlines and second, the market should level off somewhat going into the Fed meeting. Our lean is we think we could bounce, but we are also in the frame of mind of “sell the rips!”
As always, levels below. Good luck this week.
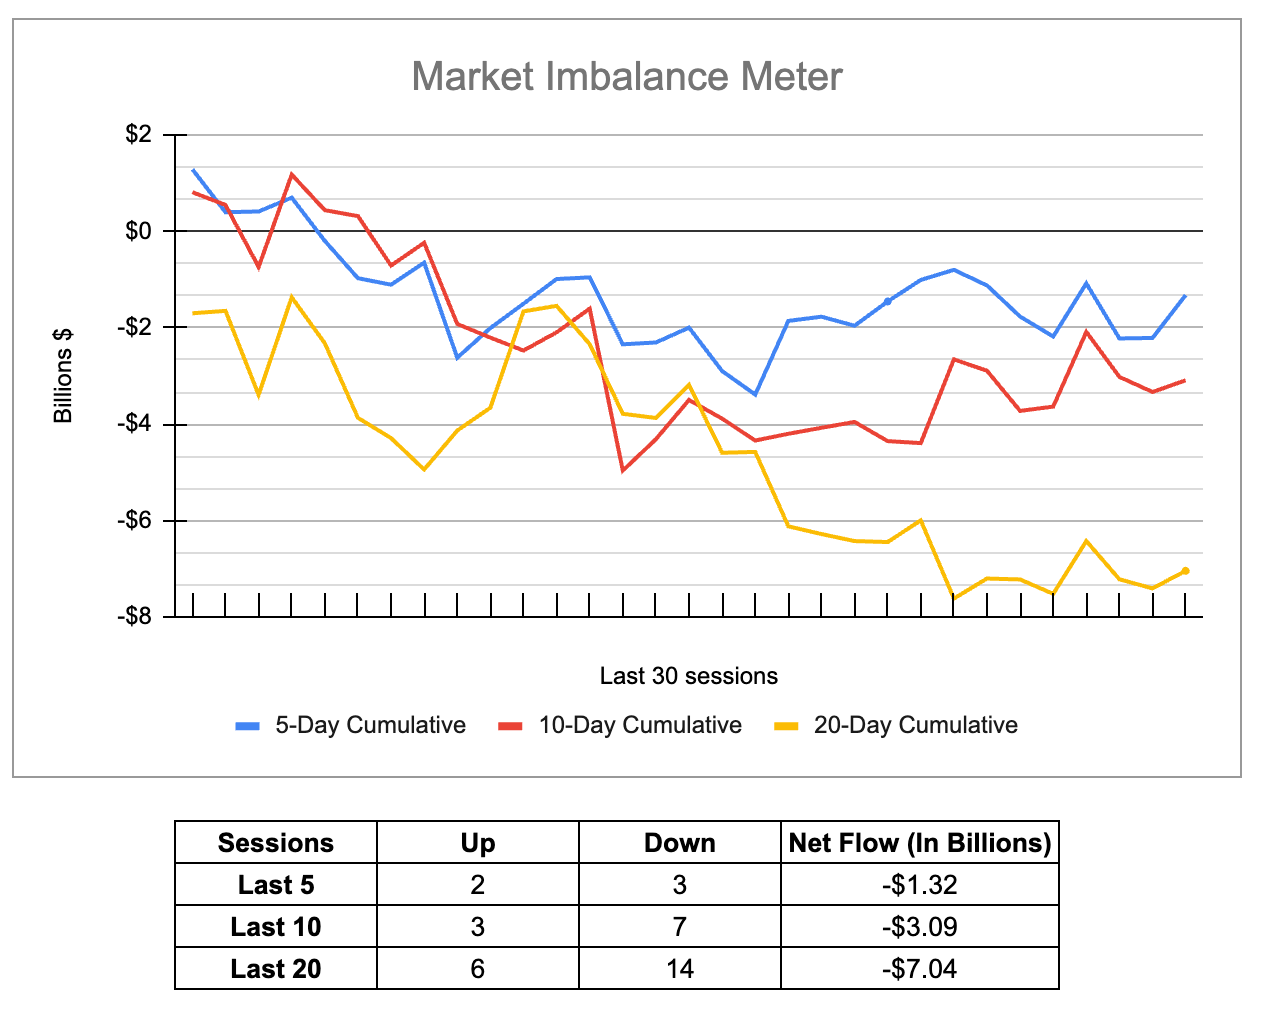
MiM and Daily Recap
The ES traded up to 4009.25 on Globex, opened Friday’s regular session at 3981.50 and pulled back a few points before rallying up to 3994.25. From there, it dropped down to 3941.25, rallied back up to the 3956 area and sold back down to a new low at 3933 at 11:40. Then the ES rallied up to 3950.25 at 12:15.
After the rally, the ES chopped around before rallying up to two separate lower highs at 3964 and 3962.50, then dropped back down to 3932.50 at 2:50. The ES recovered late, traded up to 3952 at 3:25 and traded 3942 as the 3:50 cash imbalance showed $1.1 billion to sell and traded 3948 on the 4:00 cash close. After 4:00, the ES traded sideways and settled down 46.75 points or -1.17%, while the NQ fell 67 points or -0.53%. The YM dipped 426 pts or 1.31% and the RTY took the biggest hit, down 2.42% or down 43.2 points on the day.
In the end, everything was moving. In terms of the ES’s overall tone, it was weak from the get go. In terms of the ES’s overall trade, volume was steady but not high at 2.1 million contracts traded.
Technical Edge —
-
NYSE Breadth: 15% Upside Volume (!)
-
Advance/Decline: 15% Advance (!)
-
VIX: ~$24.25
We come into the week with a “take-under” of Credit Suisse and First Republic Bank (FRC) down about 18% on the session.
I want to really focus on two sectors this week: Tech and Banks.
The banks ended the week near the lows, which is not a great sign. But on the flip side, the banks — and particularly semiconductors — churned out powerful gains.
On the one hand, it makes some sense right? MSFT, AAPL, GOOGL, etc. have fortress balance sheets and robust cash flows. In some ways, that’s the “safety trade” right now.
That said, we have pure robust relative strength in the group. NVDA rallied all five days last week. AMD climbed 18% last week. There’s no denying that this is where the strength is.
S&P 500 — ES
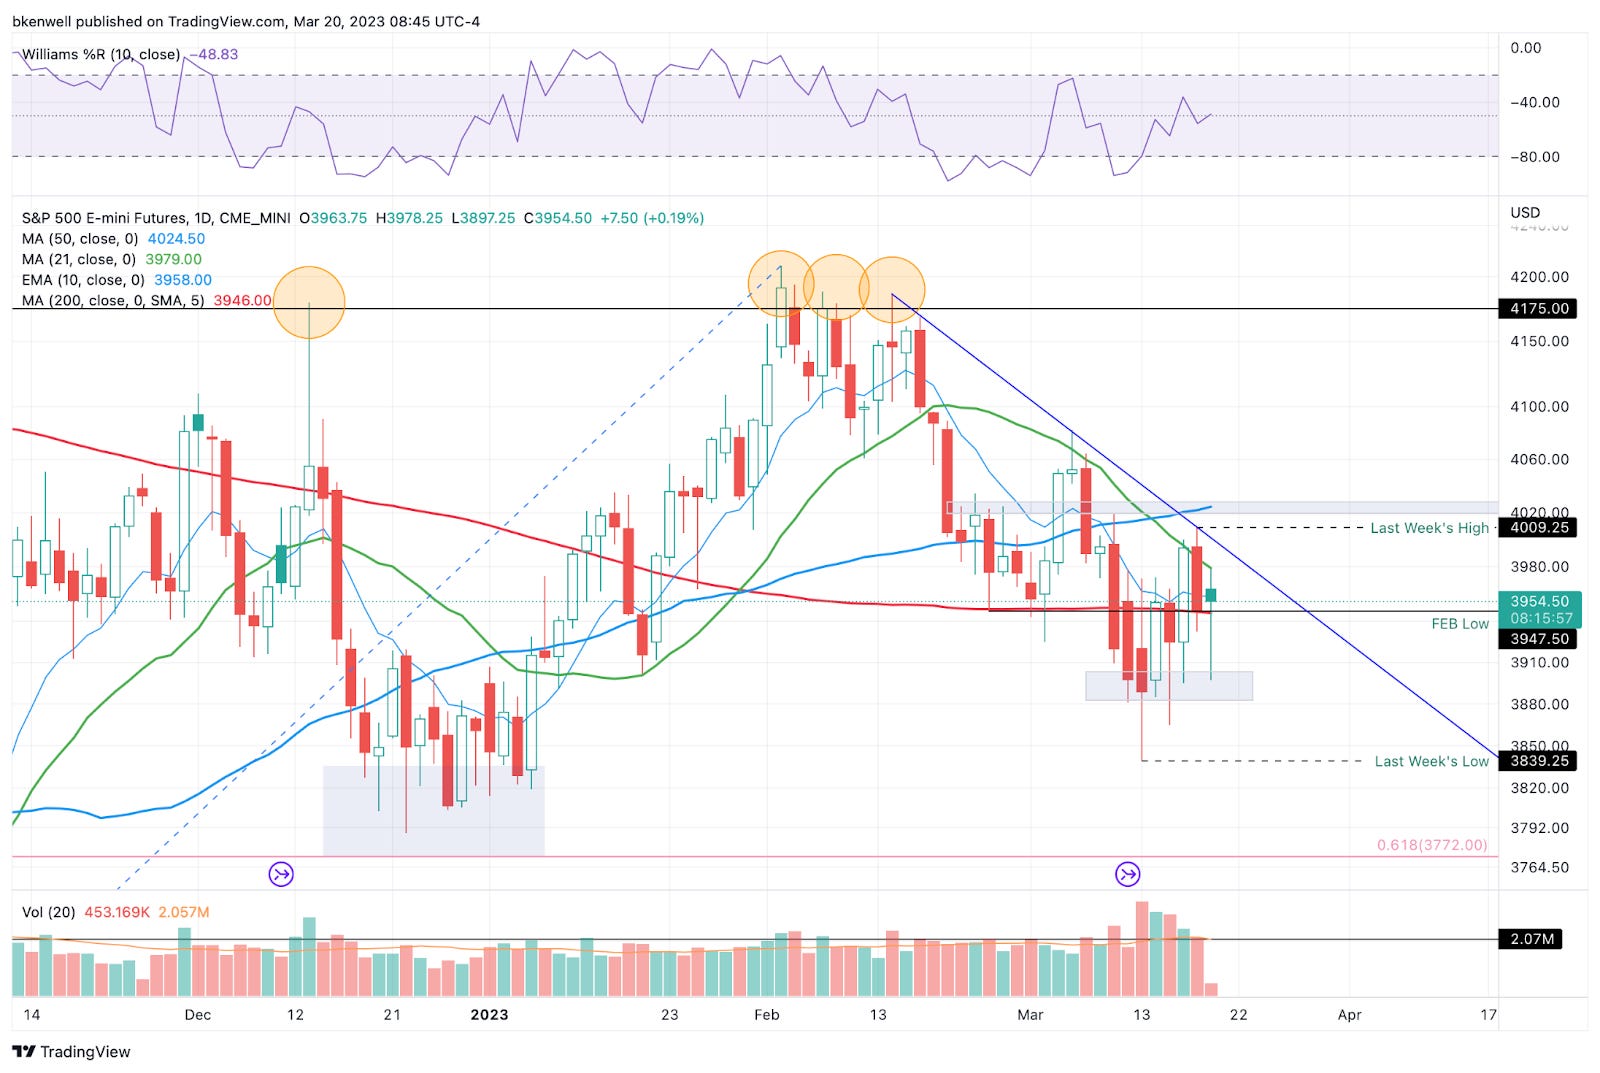
The ES has been all over the place. Now flattish as of 8:00 ET, it was up 30+ handles at one point and down 50 points at another.
It continues to pound out support in the ~3900 area, but continues to make lower highs.
-
Downside levels: 3895 to 3900, 3875, 3840.
-
Upside Levels: 3978-3980, 4000 to 4010, 4025.
SPY
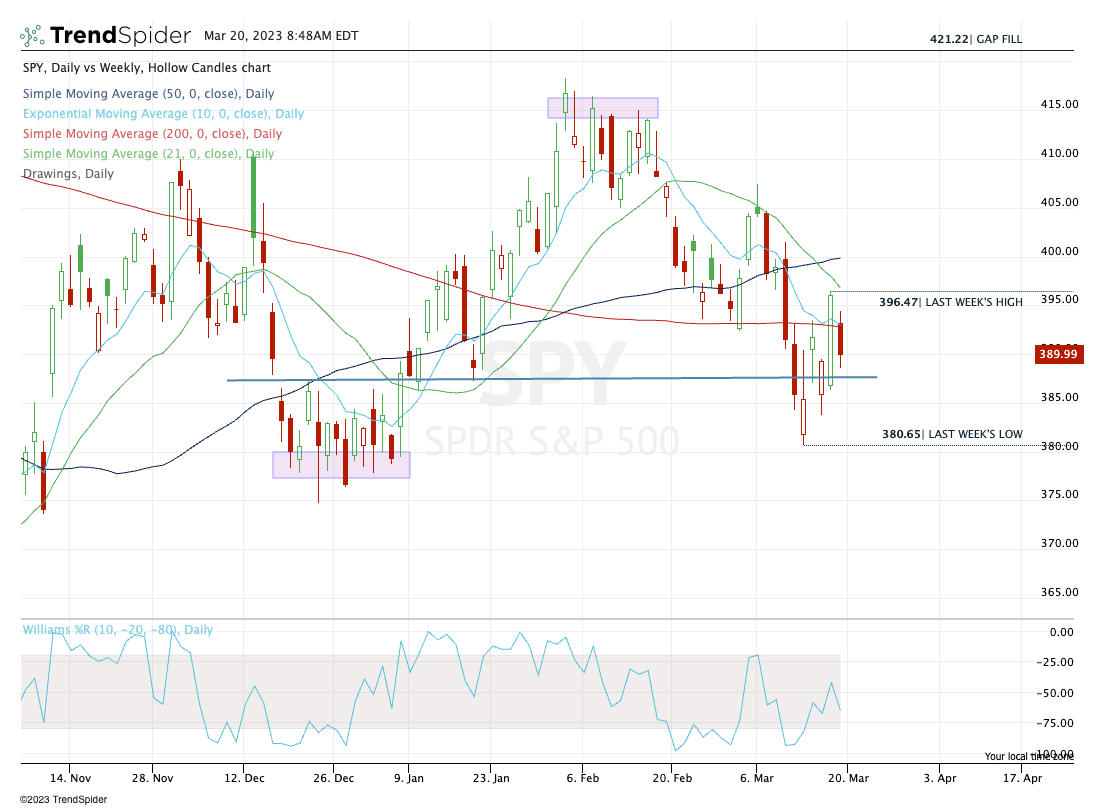
After a volatile week, the SPY essentially settled in the middle of its range.
-
Upside Levels (SPY): $393 to $394, $396.50 (weekly up), $400.
-
Downside Levels (SPY): $390, $388.50 (daily down), $387.50, $380 to $381.
SPX
Same as SPY, with following levels:
-
Upside Levels (SPY): 3945, 3959, 3964 (weekly up), 4000
-
Downside Levels (SPY): 3900, 3868 (major), 3842, 3810.
XLF

$31 is now the critical over/under, as the XLF hammered out that low over several days but closed near it on Friday.
A small up-move followed by a weekly-down would be a cause for concern. Overall, ~$30 has been support, but $29.60 could be in play on continued weakness.
Not a trade, we’re just using the XLF as a sentiment tool on the market.
QQQ
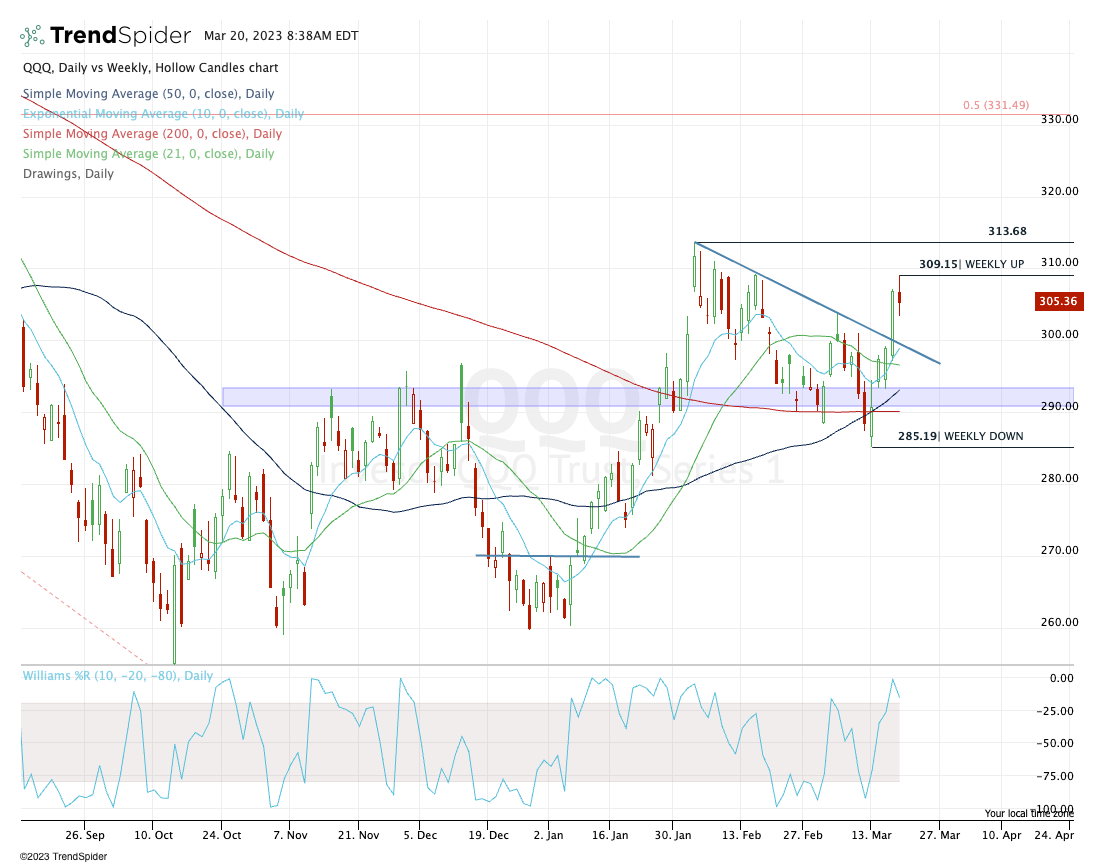
Very impressive action on the QQQ last week. Bulls will want to see a pullback to $300 hold as support.
There it finds the backside of that prior downtrend line, as well as the rising 10-day ema. If we dip to and hold this area, I’m likely a buyer.
-
Downside levels: ~$300, $293.50
-
Upside levels: $309.15 (weekly-up), $313-$314.
Open Positions
-
Bold are the trades with recent updates.
-
Italics show means the trade is closed.
-
Any positions that get down to ¼ or less (AKA runners) are removed from the list below and left up to you to manage. My only suggestion would be B/E or better stops.)
-
** = previous trade setup we are stalking.
-
MRK — Long from ~$110 and (disappointing action as it was oh-so-close to our first target, missing by a few dimes) — Ideal stop is clearly defined near $105. Initial target for ⅓ trim is $112.50.
-
Natural Gas, UNG or /NG — First target hit at UNG ~$10 and NG at 2.95 to 3.00.
-
FSLR — aggressive bulls long from $202, conservative bulls not long w/o daily-up rotation —
-
Upside levels are $210.75, $214 and potentially $217+. If you are long from $200 to $202, can consider a small trim at daily up at $206.67. Stop at $198
-
Go-To Watchlist
*Feel free to build your own trades off these relative strength leaders*
Relative strength leaders →
-
NVDA, AMD, AVGO
-
CRM
-
MSFT, GOOGL
-
PANW, FTNT
-
FSLR
-
GE
-
DKS
-
AQUA
-
ULTA
-
AEHR → volatile!
-
MELI
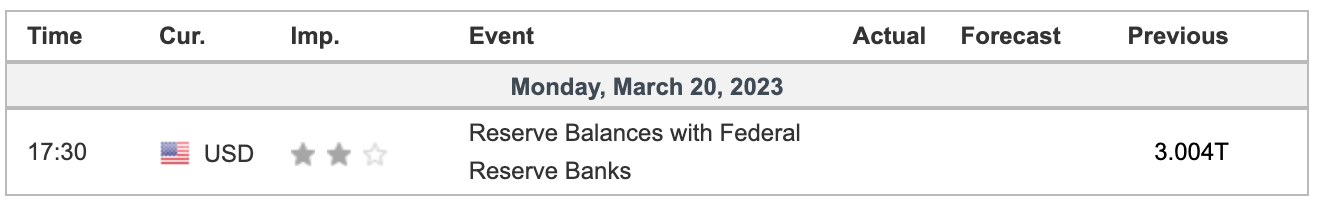
Economic Calendar
No responses yet