Hello subs! As (hopefully all of) you know, we have switch newsletter providers! This will allow us to seamlessly add more features and create more value down the road. That said, there is a learning curve when you flip the “go-live switch” — even if we have been practicing on the new system! 🙂
So for that reason, we will continue to send from both providers this week, making sure we can work out the kinks and to make sure every premium sub is receiving the new newsletter.
Thanks for bearing with us through this transition. It will definitely be worth it!
Our View
The Fed’s two-day meeting begins today, with a rate decision due up tomorrow afternoon at 2:00 p.m. ET, followed by a press conference 30 minutes later. I was talking with another old floor trader the other day and how they used to take off for the mornings of the Fed days.
They wanted to hear the announcement and then trade the action with as little bias as possible. In the current day of online trading, instantaneous news flow and of course, algorithmic trading, it’s a much different environment than 30 years ago.
In any regard, today is one big pre-Fed trading day and it could be a lot like yesterday’s action — a choppy, upside grind. This morning’s gap-up complicates matters a bit (but more on that in a minute).
Wall Street will look to put the “failing bank” rhetoric on the back burner for a day or two until we get the Fed out of the way. Lastly, it seems like 100 point ranges are back in style as are the Feds bailouts.
Our Lean
Coming into the session, it’d be much easier if we weren’t gapping notably higher on the day. As of 8:00 a.m. ET, the ES is up 36 handles (0.90%) and the NQ is up 92 (0.73%).
Tech opened pretty weak yesterday, but came roaring back to life. This group has been quite strong despite increasing rates. I think it’s acting as a “safe-haven” trade for investors bailing on banks and other reg-flag businesses.
Our Lean: I’m sorry but I’m not buying a ~40 handle gap-up open. Especially as it pushes into our 4020 to 4030 resistance area. In that zone (and preferably 4025-4030), I am a seller and will try to fade the gap-up. That said, you can skip the gap-up fade and simply look to buy the pullbacks if you’d rather.
If the ES can stay over last week’s high of 4009, it’s very constructive for the bull case. And a sustained rally over 4030 could open the door to 4055, then 4080. More levels below.
MiM and Daily Recap
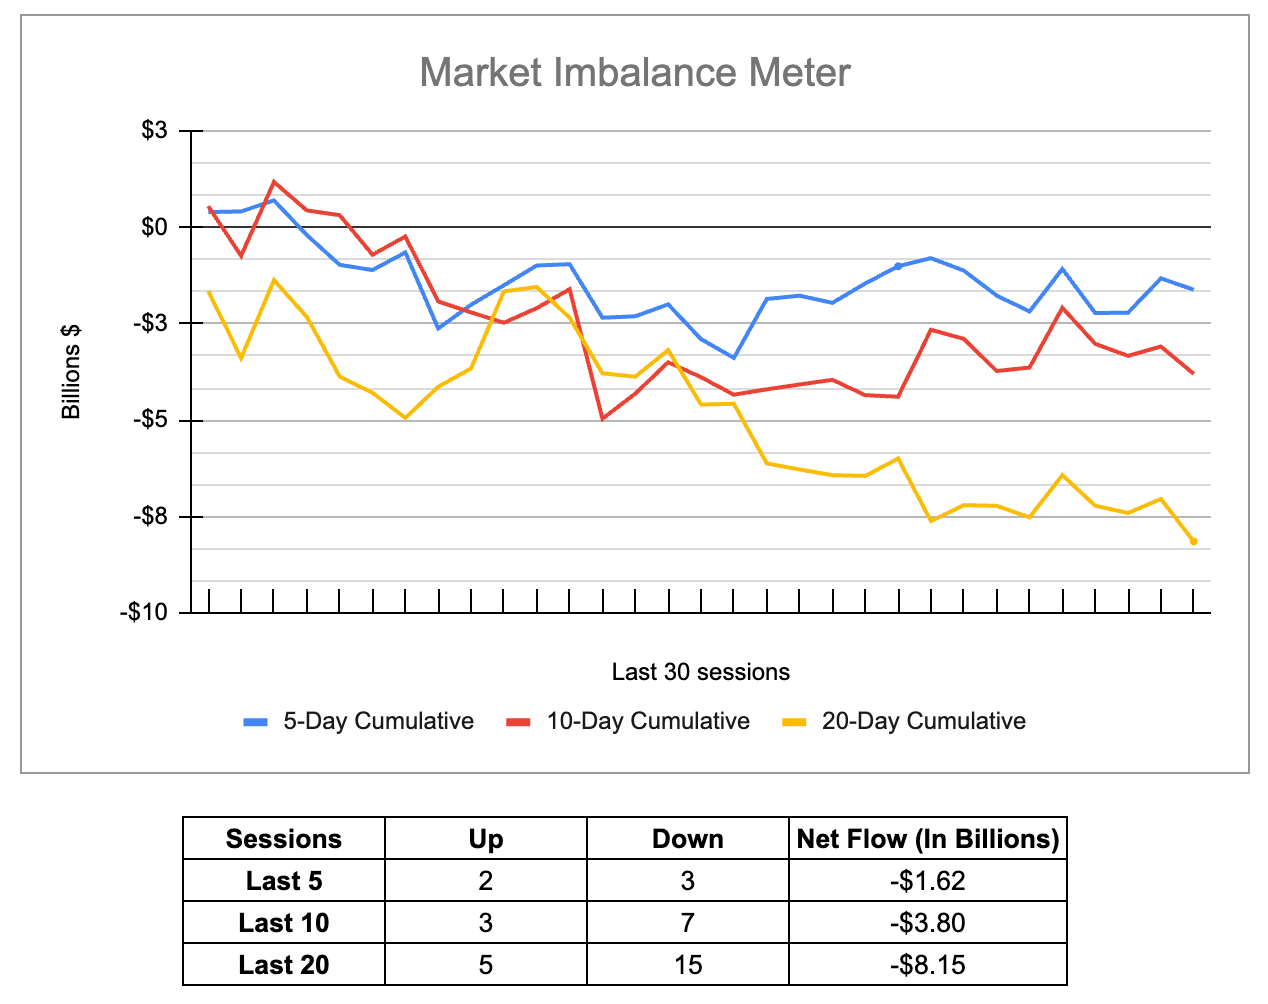
The ES had a near 80-pt range in Globex, after an early rally up to 3978.25 and sold off down to 3897.25 and opened Monday’s regular session at 3954.50. After the open the ES rallied up to 3966.25 and then pulled back to the 3955 level at 9:45, then made 5 separate higher highs up to 3889.50 at 11:15 and then dropped down to 3954 going into 12:00. After the pullback, the ES stutter-stepped up to lower high to 3986 at 1:15 and pulled back down to the 3966.75 at 2:40, rallied back up 3981.50 at 2:50 and then traded down to 3969.75 as the ealy imbalance flipped from $362 million to buy to $850 million to sell.
The ES traded 3984.50 as the 3:50 cash imbalance flipped again, showing $63 million to buy and rallied up to 3989. On the 4:00 cash close, the ES traded 3984.50 and settled at 3987.50 on the 5:00 futures close, up 40.50 points or 1.04% on the day.
In the end, the best trade was on Globex when the ES was up 30 points and dropped 80. In terms of the ES’s overall trade, it was a choppy upside grinder. In terms of the ES’s overall trade, volume was lower at 1.476 million contracts traded.
Technical Edge —
-
NYSE Breadth: 61% Upside Volume
-
Advance/Decline: 59% Advance
-
VIX: ~$22.75
When the Fed’s all said and done, which side is it going to deal a blow to?
Put another way, will the bulls suffer or will the bears — or could it be both? Despite a world of rising rates and failing banks, the S&P continues to hold in. That’s even after declining in 4 of the last 6 weeks.
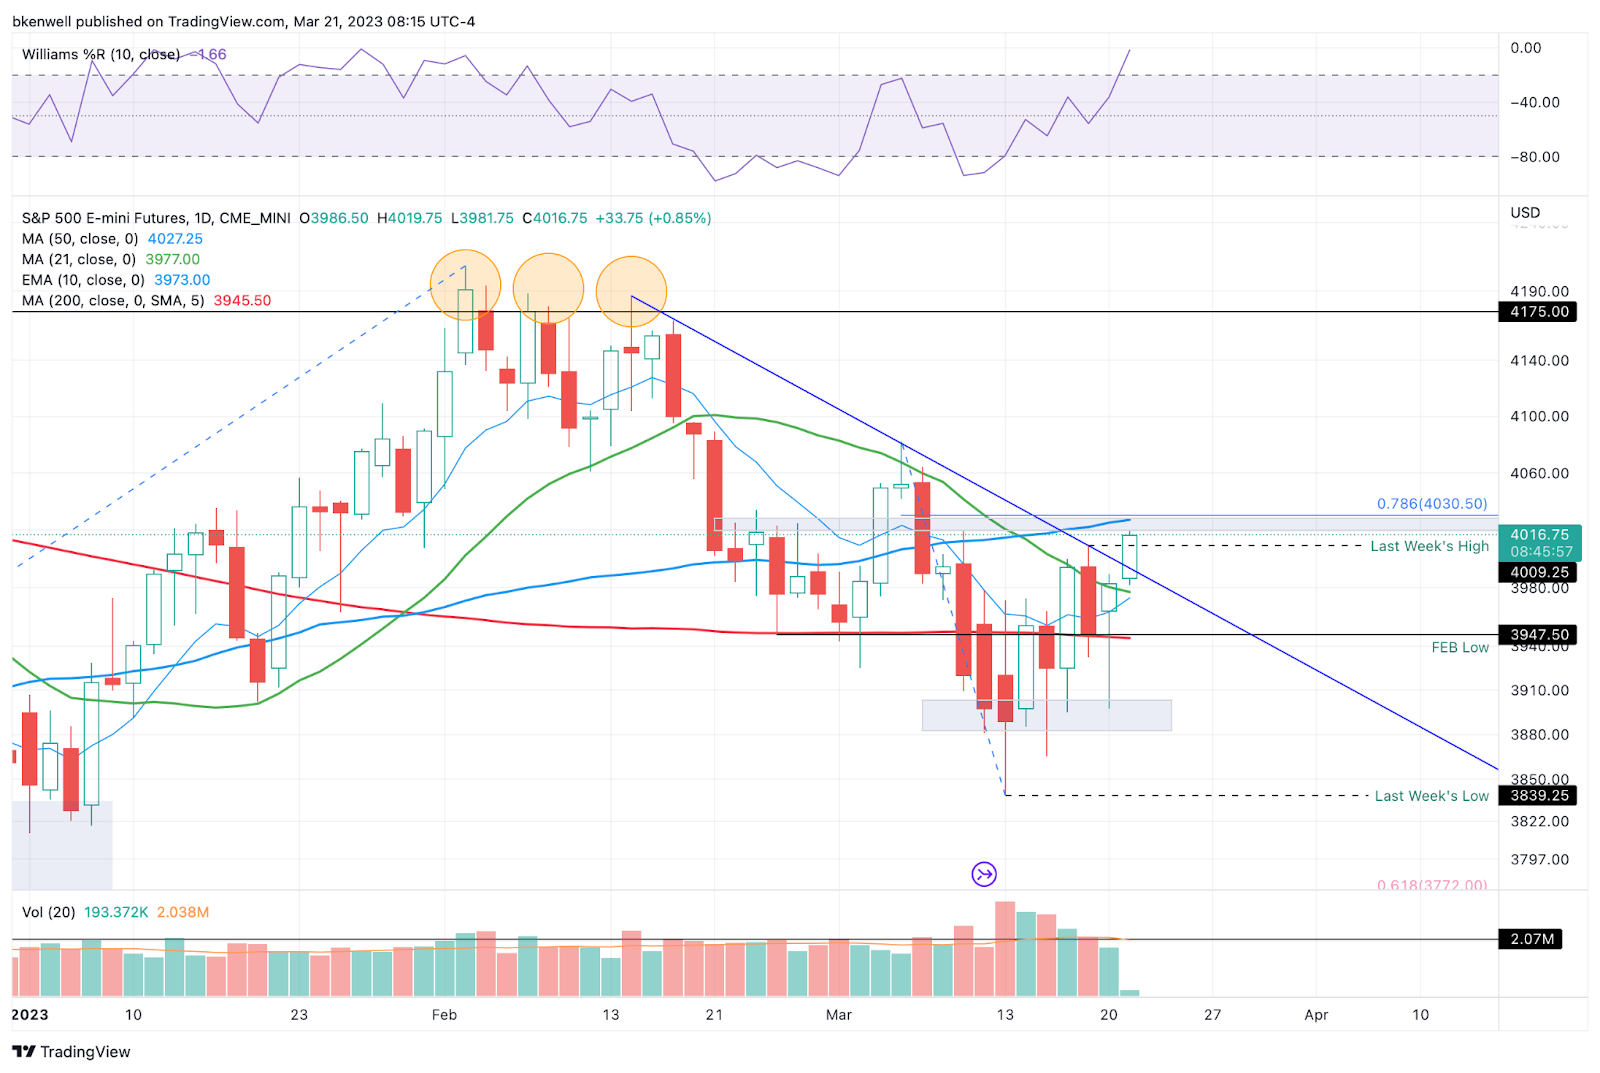
This morning the index is breaking out over downtrend resistance and, at least for now, is rotating over last week’s high.
S&P 500 — ES
-
Downside levels: 4009 (last week’s high), 3990, 3975 & 3948-3958.
-
Upside Levels: 4020 to 4030, 4055, 4080.
SPY
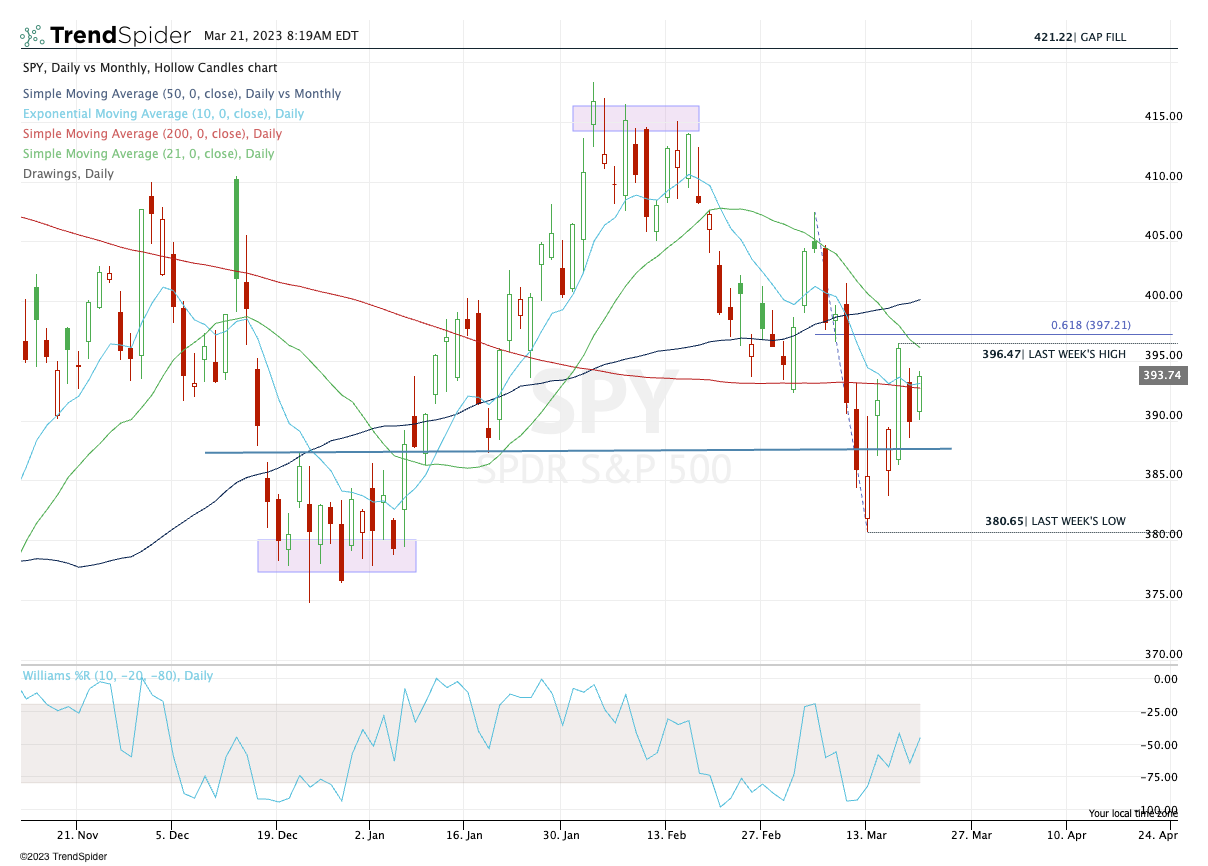
Tough to buy a gap-up into last week’s high and the 61.8% retrace ahead of the Fed. While it’s always possible we get a “gap-and-go,” trading around $396.50 to $397.25 as a key pivot is likely the way to go.
My gut calls this area resistance, at least initially. However, if we can sustain above it, $400 is in play.
-
Upside Levels (SPY): $396.50 (weekly up), $397.25, $400.
-
Downside Levels (SPY):$394.35, $392.50, $390.
SPX
Same as SPY, with the following levels:
-
Upside Levels (SPY): 3975, 4000-4010, 4021
-
Downside Levels (SPY): 3964 (weekly up), 3951, 3936
QQQ
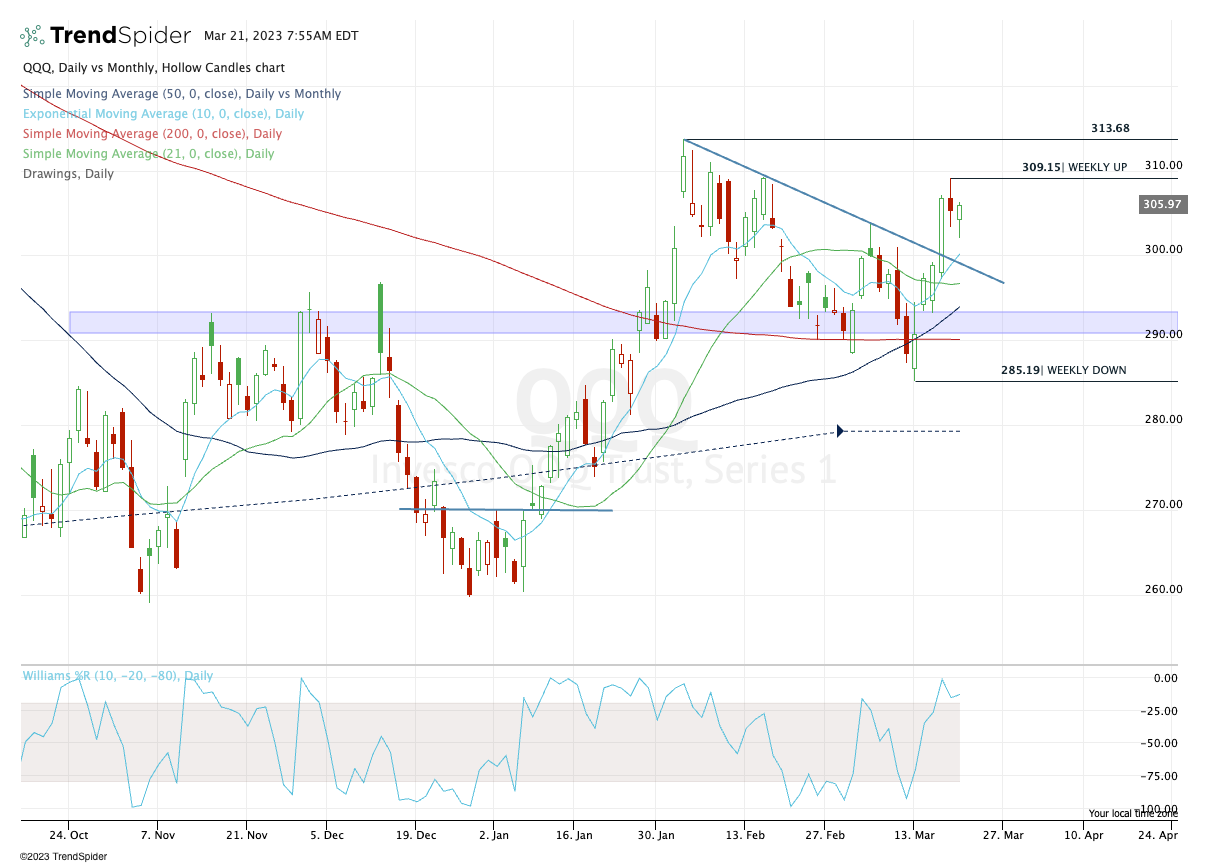
Early selling pressure on Monday gave way to a bullish reversal and we didn’t quite get our ~$300 area to buy. That’s okay, as we shift perspective on Tuesday.
-
Upside levels: $309.15 (weekly-up), $313-$314
-
Downside levels: ~$300, $293.50
Apple
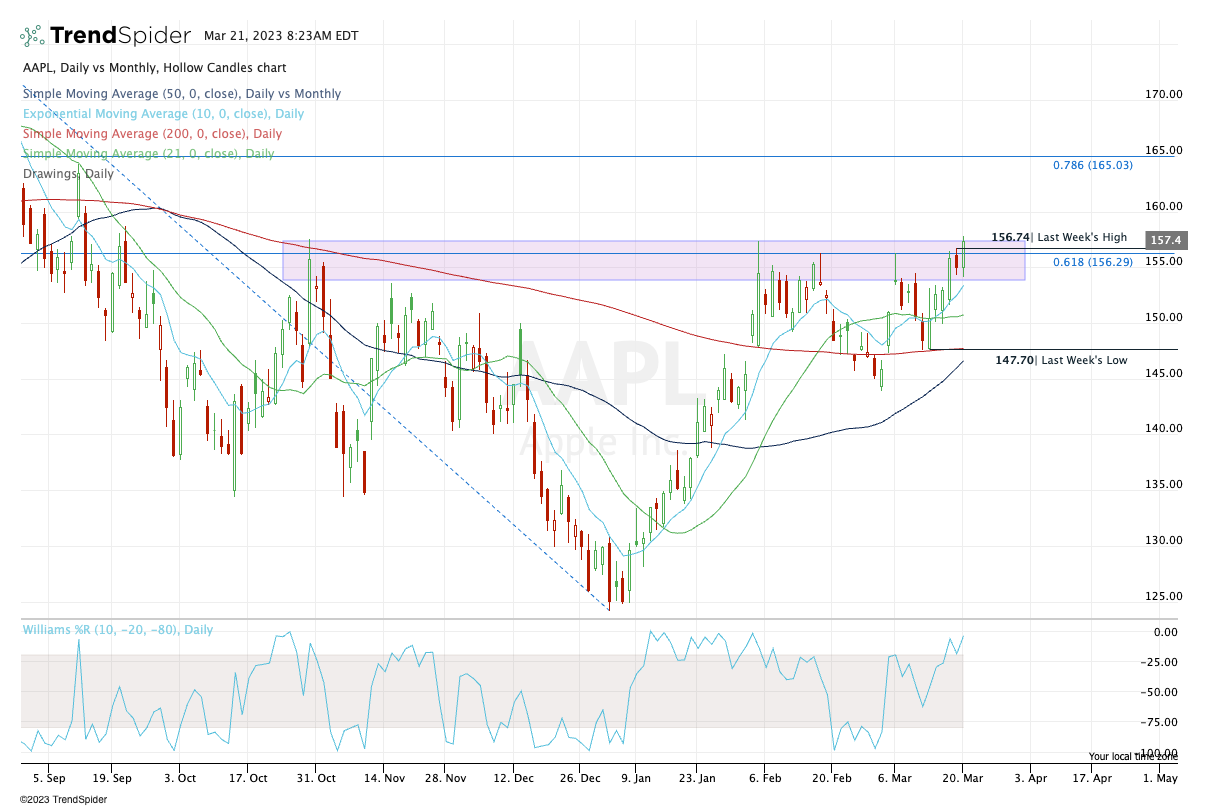
A cup-and-handle formation for Apple?
The stock went weekly-up yesterday over $156.74 and largely, it has been struggling with this area as resistance. If it can stay above last week’s high and the 61.8% retrace at $156.29, I think we can be long this one — consider a half size for the following reason:
Of course, the Fed makes this monumentally more difficult and the environment is not all that constructive for long-term swings. That’s why I didn’t alert it yesterday. Further, it’s not partaking in today’s pre-market pop.
The Trade: Aggressive buyers can get long off the open and hope for some catch-up to the indices. Conservative buyers will wait for a daily-up over $157.82 (and at least a 15-min close over that mark).
Big tech (like MSFT) has been trading very well lately.
DKS
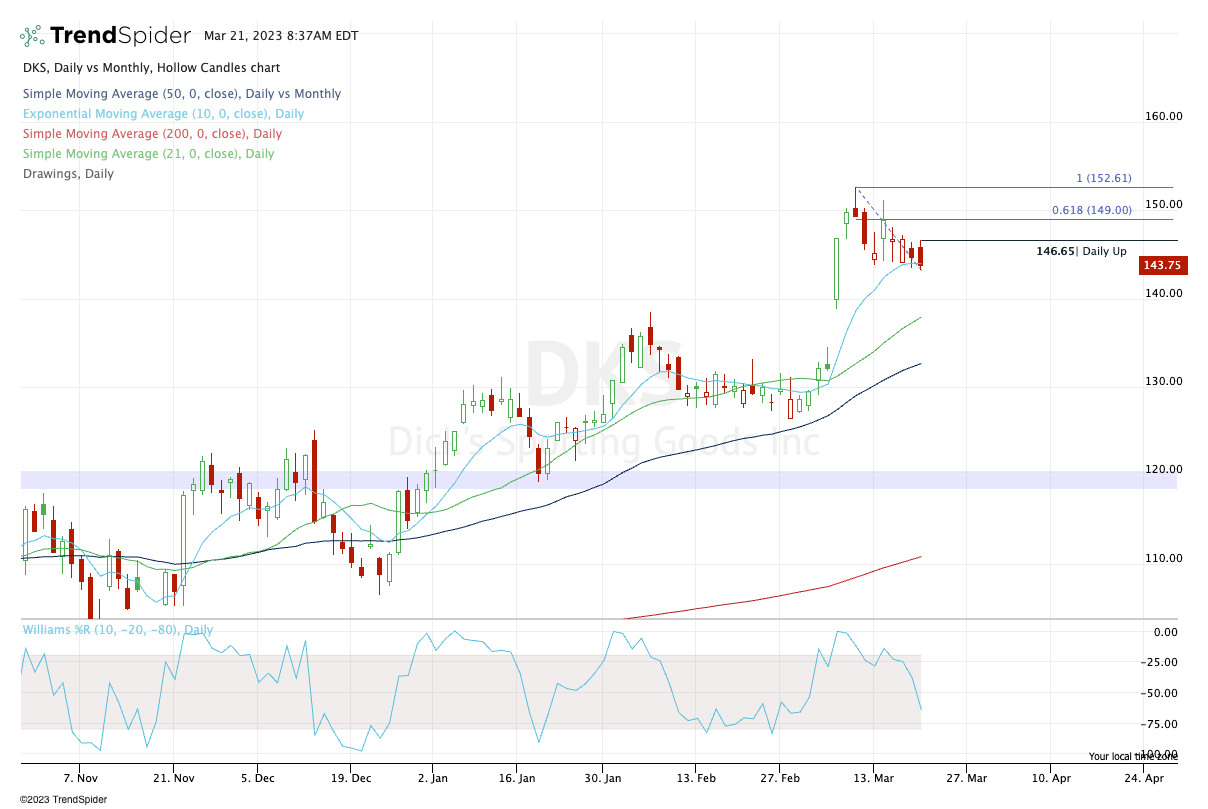
Let’s see if DKS can go daily-up over $146.65. That would open the door to $149-$150, then $152.50+.
Downside stop could be near $142.
Open Positions
-
Bold are the trades with recent updates.
-
Italics show means the trade is closed.
-
Any positions that get down to ¼ or less (AKA runners) are removed from the list below and left up to you to manage. My only suggestion would be B/E or better stops.)
-
** = previous trade setup we are stalking.
-
FSLR — aggressive bulls long from $202, conservative bulls not long w/o daily-up rotation — if still long, consider a trim on gap-up open near 206 to 207
-
Upside levels are $210.75, $214 and potentially $217+. If you are long from $200 to $202, can consider a small trim at daily up at $206.67. Stop at $198
-
Go-To Watchlist
*Feel free to build your own trades off these relative strength leaders*
Relative strength leaders →
-
NVDA, AMD, AVGO
-
CRM, GOOGL
-
MSFT — Nice setup on H4 chart
-
PANW, FTNT
-
FSLR
-
GE
-
DKS
-
AQUA
-
ULTA
-
AEHR → volatile!
-
MELI
Economic Calendar

No responses yet