August Opex: Will Things Get Ugly?
The trend has been ‘locked and loaded’ to the downside
Follow @MrTopStep on Twitter and please share if you find our work valuable.
Our View
One of MrTopStep trading rules is “no stops go untouched in the S&P futures.” That’s been clear amid this downtrend. It’s also been clear when we zoom out and look at the price action. Take the KRE bank index for instance. They have run the upside and the downside stops.
Just look at the monthly chart:

KRE Monthly
Further, Bitcoin tumbled $2,000 after the close when SpaceX documents viewed by The Wall Street Journal show that the private space company has sold all its Bitcoin after writing down the value of its holdings in 2021 and 2022. Tesla sold 75% of its Bitcoin holdings last year.

Bitcoin daily
I am not going to do a big view. I have named several things overshadowing the stock market for weeks — everything from commercial real estate defaults to China’s economic woes to Putin’s war in Ukraine.
I am sure the markets will bounce at some point, but right now the trend has been locked and loaded to the downside.
Our Lean
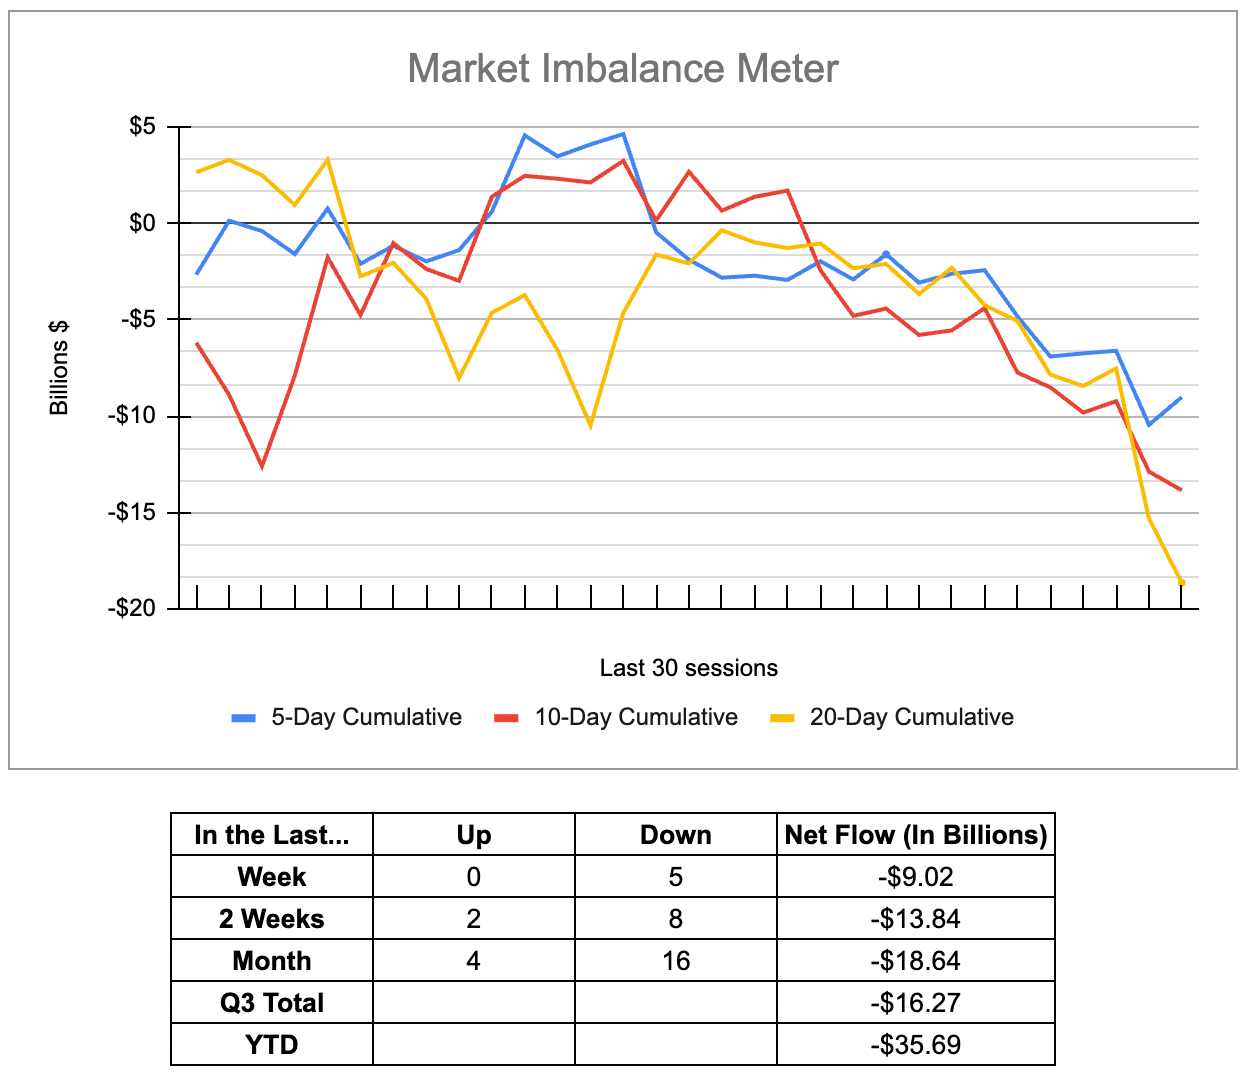
MIM totals
You all know this image from the MIM & Recap section below, but I want to bring it to your attention in the Lean today.
I always pay attention to the late day imbalance, but if you don’t look at its accumulations, it has a way of sneaking past you. I have always said if you want to know where the ES is going, follow the money and clearly the $9 billion sold last week and the $13.8 billion sold over the last two weeks has been telling. Almost $20 billion has flowed out on the imbalance over the last month.
As I have said many times, August is the new September. Let’s face it, there was no fear in the fear and greed gauge — and it’s still not very fearful! — nor was there much fear when the VIX tumbled to $12.74 on July 27 (that was its lowest price since the pre-Covid pandemic, by the way).
Our Lean: Bad got worse and ugly got uglier this week. Will the August expirations gamma cause a rally? If it does, it will be early and late…and even then, I’m not even sure it will matter. After a ~530 point rally off the May low and a ~750 point rally off the March low, the ES is correcting. It has given back almost 260 hundred points already.
For what it’s worth, the 50% retrace from the May rally is 4370 — Friday’s Globex low is at 4375.25 — and the halfback to the March low is 4258.75.
Our lean is to sell the 30- to 40-point rips.
As for levels, I am keeping an eye on the 4370 area. If we hold here, 4400-10 could be back on the table. If the ES can’t hold this level, 4350, 4333, 4320 and 4300 are on tap — and could be in a hurry if things get ugly!
MiM and Daily Recap
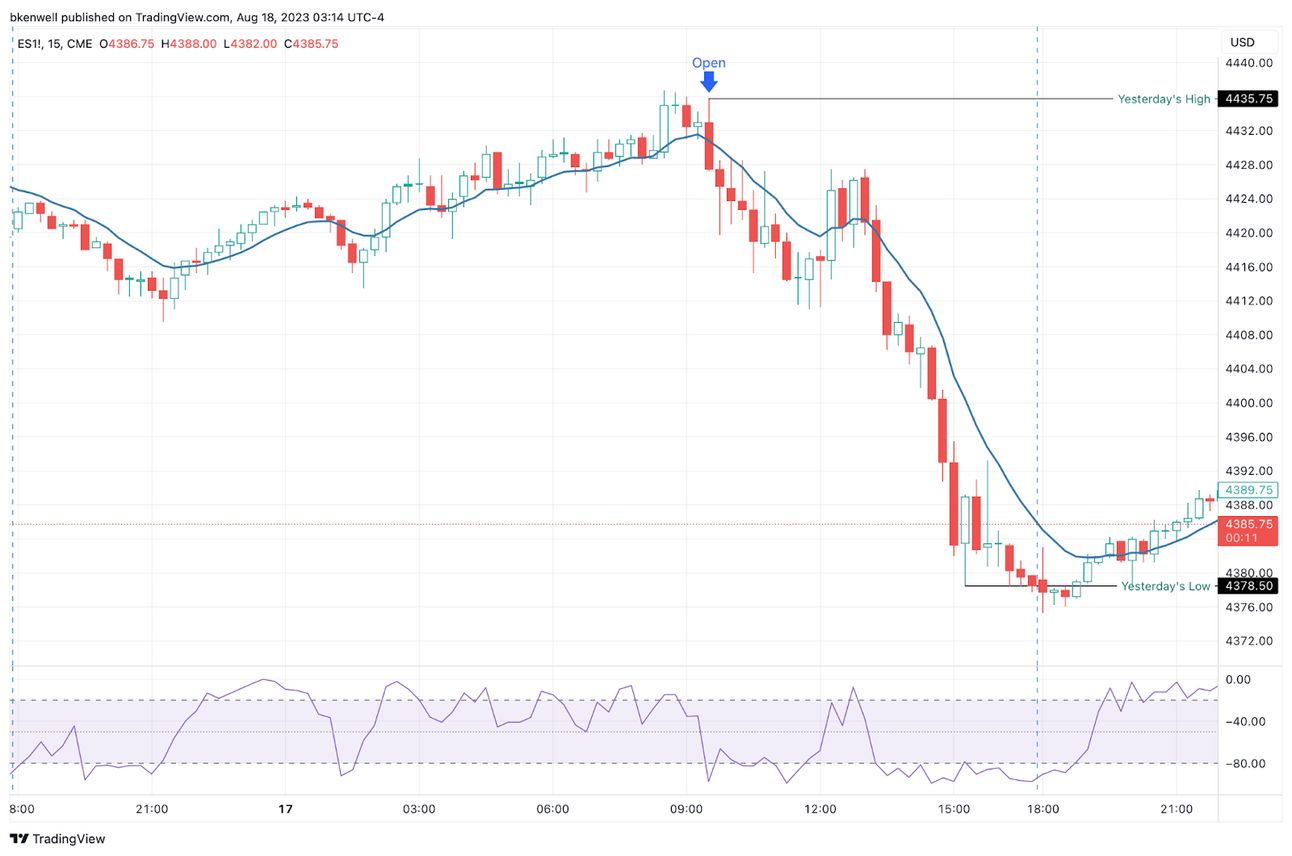
ES – 15 min
The ES traded down to 4409.50 and traded up to 4436.75 on Globex and opened Thursday’s regular session at 4432.25. After the open, the ES traded up to 4435.75, sold off down to 4419.75 at 9:56, back-and-filled in a 6- to 8-point range until 4415.25, rallied back up to a lower high at 4427.25 and dropped down to 4411. After a little sideways-to-up price action, the ES rallied back up to 4427.50 — one tick above the previous bounce — sold off down to a new low at 4406.25 at 1:51 and then made nine consecutive lower lows down to 4378.50 at 3:16.
Yes there were up-ticks, but every one of them was sold. After the low, the ES rallied back up to the 4391 level and sold off down to 4380.75 at 3:46. The ES traded 4383.50 as the 3:50 cash imbalance showed $155 million to buy, traded up to 4393.25 and traded 4383.50 on the 4:00 cash close. After 4:00, the ES sold off down to 4377.75 and settled at 4378.50 on the 5:00 cash close, down 41 points or -0.93% on the day.
In the end, it was all sell programs and sell stops. In terms of the ES’s overall tone, it was the weakest price action I have seen in the last two weeks. In terms of the ES’s overall trade, 242K contracts traded on Globex and 1.313 million contracts traded on the day session for a total of 1.562 million contracts traded.
Technical Edge
-
NYSE Breadth: 38% Upside Volume
-
Advance/Decline: 30% Advance
-
VIX: ~$18
I think a few things are worth noting.
-
Know your timeframe. There’s a big difference in trading the 5-15-30 minute timeframes vs. the daily/weekly setups. The person focused on the next 4-8 hours is going to have a different approach vs. the person focused on the next 4-8 weeks.
-
I’m not too keen on shorting into the hole. With the S&P down ~11 (technically 10) out of 13 sessions and down 240 handles from the high, I’m not looking to sell the lows.
-
Look for clues. When — not if — we bounce, how is prior support handled? Does the S&P quickly reclaim these levels or are these levels resistance? If it’s the latter, investors must be flexible enough to realize we could be in for a larger and longer correction.
-
Keep perspective. The SPX put had a 5-month win streak with a 21% gain. To give back 30% to 50% of that rally would be normal (and healthy).
SPY
The SPY continues to flush, but the selling has been controlled and breadth hasn’t really been exuberant on the downside. For instance, we’ve had one 80/80 downside day (breadth/decliners) so far this month.
Keep an eye on yesterday’s low of $435.75. That’s today’s pivot. Above and a bounce is possible — potentially all the way up over $440. If the SPY can’t get above and stay above $435.75, then $430 is possible.

SPY Daily
-
Pivot: $435.75
-
Upside Levels: $440, $441.50, $444
-
Downside Levels: $430-$431
SPX
-
Pivot: 4364
-
Upside Levels: 4400, 4420, 4435, 4445-50
-
Downside Levels: 4328, 4300
S&P 500 — ES Futures
Watch 4370-75. A break of this area that isn’t regained puts 4350 in play. On the upside, 4400 and 4420 are on watch, followed by a possible move up into the 4460s.

ES Daily
-
Pivot: 4375
-
Upside Levels: 4400, 4420, 4460s
-
Downside levels: 4370, 4350, 4320-25

ES 4-hour
If we get a rally going, one can see how the 4406 to 4413 area could be an issue for the ES.
NQ
Well, well, well…look at that 14,750 to 14,850 area.
Let’s watch the Globex range. A break of the high without reversing and we can power back up to the 15,000+ area. A break of the low without regaining it and the sellers remain in control.
Daily & 4-hour:

NQ Daily

NQ 4-hour
-
Upside Levels: 14,870-905, 15,000, 15,100, 15,300-340
-
Downside levels: 14,725-750, 14,672-695, 14,425
QQQ
QQQ flush gave us into the $357 to $358.50 area. It’s hard for me not to be looking for a bounce here, especially if we were to open below yesterday’s $358.16 low and then quickly reclaim that level. That would probably have me looking at next week’s or the month-end $360 calls to speculate with.
This may not be the bottom, but odds of a bounce are growing IMO.

QQQ Daily
-
Pivot: $358.16
-
Upside Levels: $361.50 to $362, $364.50 to 365.75, $367.50
-
Downside levels: $354.50, $352
TNX

TNX Daily
Within spitting distance of the 52-week/multi-year high of 4.333. Until TNX takes a chill pill, it’s a headwind for equities…as stock traders suddenly seem to care about yields.
CRM

CRM Daily
Here’s why I’m looking for a long position in CRM. Should we see it, September or October calls or call spreads could be an option. Specifically, I’ll be looking at the $210 calls if we see the ~$200 area.
Calls are great, because our max risk is simply price paid. If you don’t want to risk more than $X on the trade, don’t spend more than $X on the calls.
Open Positions
Bold are the trades with recent updates.
Italics show means the trade is closed.
Any positions that get down to ¼ or less (AKA runners) are removed from the list below and left up to you to manage. My only suggestion would be break-even (B/E) or better stops.
** = previously mentioned trade setup we are stalking.
Down to Runners in GE, CAH, LLY, ABBV, AAPL, MCD & BRK.B. Now Add META, AVGO, UBER, CRM, AMZN, CVS, AMD, TLT and YM.
Let’s be grateful that we had 5+ months of excellent trades and then came into this correction with relatively low exposure, B/E stops and partial positions.
-
JPM — Many are long from $143-145. This is a longer term swing. Trimmed $153s, then $157.50+ on 7/24.
-
Down to ½ position vs. Break-even stop. Can make small, ~10% position trim if we see $160
-
Consider a stop-out so we can reload in the low-$140s if JPM falls that far.
-
-
XOM — long from the monthly-up area at $108.50 — First ¼ or ⅓ trim is ~$112.50. Stops at $104.
-
**CRM — Would still love to see a dip down to the low-$200
-
**UNH — Nixed — too sloppy after yesterday’s trade.
Go-To Watchlist
Feel free to build your own trades off these relative strength leaders
Relative strength leaders →
-
LLY
-
Energy stocks — VLO, SLB, EOG
-
AI stocks — NVDA, ADBE
-
Mega cap tech — GOOGL, AMZN
-
Select retail — ELF, LULU, COST
-
BRK.B (new all-time highs)
-
CAT
-
RCL
Relative weakness leaders →
-
DIS
-
PYPL
-
EL, FL, DG
Economic Calendar

Disclaimer: Charts and analysis are for discussion and education purposes only. I am not a financial advisor, do not give financial advice and am not recommending the buying or selling of any security.
Remember: Not all setups will trigger. Not all setups will be profitable. Not all setups should be t. These are simply the setups that I have put together for years on my own and what I watch as part of my own “game plan” coming into each day. Good luck!
Update your email preferences or unsubscribe here
© The Opening Print
228 Park Ave S, #29976, New York, New York 10003, United States
No responses yet