Do We Have a “Good” Low or Is This a Setup?
The Fed and Nvidia take focus this week.
Follow @MrTopStep on Twitter and please share if you find our work valuable.
Our View
I think it’s fair to say that we don’t know if the 4350 low is a good low or just another short-covering trap for another smash lower. I can’t speak for you, but to me everything seems so frayed.
What I do know is that higher yields are affecting people’s buying power. Last week Americans poured $36 billion into money-market funds in the latest week, taking advantage of yields that have soared past 5%.
According to Refinitiv Lipper data, through Aug. 16th it was the largest weekly inflow since May. The yield on the 10-year Treasury note settled Friday at 4.251%, near its highest level since 2007.
I’ve always said I’m not an economist, but Parker Schwartz told me that if the 10-year yield approaches 5%, it is the bond market’s way of saying that the Fed won’t cut rates for an extended period of time. There is definitely a mindset that a large part of investors would rather make 5% on their money over it being put to work in the ‘risky’ stock market.
Do I agree with that?
The answer is yes and no.
The yes being if you are not overly invested in the stock market and no if it means liquidating your mutual fund or retirement account. But…I also would not say “no” to taking some of the mutual fund money and locking in 5% either.
Our Lean
Even when you think it could be a slow week, all it takes is one tape bomb to blow things up.
This week the annual Jackson Hole Economic Symposium kicks off on Thursday along with Nvidia reporting earnings after the close on Wednesday. And FRY-day starts out with the all-important Fed Chair Jay Powell giving his speech on his view of interest rates and the overall state of the economy, along with inflation pressures that could prompt a rethink of the Fed’s current goals.
I suspect with the FRY-day options expiration and Powell talking, it could be an explosive end of the week.
That said, as traders we live in the here and now and I told the PitBull that if the ES holds 4350, I think we will see higher prices. While I can’t rule out selling a gap up, my bias is for higher prices.
As for levels, I am watching the 4430s for potential resistance. Not only is that the 50% retracement of last week’s decline, but it’s about 80 handles off the low. If the pattern sticks — i.e. selling the rallies — this area should be resistance.
MiM and Daily Recap
The ES sold off down to 4353 and opened Fryday’s regular session at 4353.50. After the open, the ES made the low for the day at 4350, rallied up to 4367.50 at 9:45, sold off to a higher low at 4354.50 at 10:18 and then rallied up to 4381 at 11:19. From there, the ES sold off down to the VWAP at 4367.25 at 11:42 and then rallied up to a 4385.75 double top at 12:11. After the high, the ES pulled back to 4367.25, rallied back up to 4385.50 at 12:55 and then dropped down to 4367.25 at 1:25.
That low set up a rally up to 4387.75 at 2:42 before it dropped down to 4373.50 at 3:14. After a little back-and-fill, the ES rallied up to 4382.50 and shot up to 4396 at 3:47. The ES traded up to 4396 at 3:47 and traded 4392.50 as the 3:50 cash imbalance showed $2.5 billion to buy. The ES sold off down to 4378.50 at 3:55 and traded 4384.75 on the 4:00 cash close. After 4:00, the ES popped up to 4390, pulled back to 4379.25 and settled at 4380 on the 5:00 futures close, up 1.5 points or +0.03% on the day.
In the end, despite the early drop it was a “no harm, no foul” kind of day. In terms of the ES’s and NQ’s overall tone, they both closed modestly higher after a decent early drop. In terms of the ES’s overall trade, volume was on the high end with 302k futures traded on Globex and 1.35 million traded on the day session for a grand total of 1.647 million contracts traded.

Technical Edge
-
NYSE Breadth: 60% Upside Volume
-
Advance/Decline: 56% Advance
-
VIX: ~$17.50
The one question I have for today and the early part of this week is, will they market put the pain-trade on the late shorts who sold into the hole — remember on Friday, we said we don’t want to sell into the hole — or will this gap-up fizzle out quickly and markets will roll back over?
I could see both scenarios play out today, so it’s best to prepare for both.
I will note that bonds are not playing ball, with the TLT set to open at new 2023 lows and with the /ZB futures at new 52-week lows this morning (and near 10-year lows when adjusting the contracts for the quarterly rolls). That’s got yields up and is something equity bulls need to keep in mind.
Please take a look at the weekly setup on the ES to get an idea of one possible longer-term scenario.
SPY — #KISS
SPY is set to gap-up on the open. Watch for an open above the $437.57 high from Friday. That’s our pivot. If we hold that area, $440+ is possible as they turn up the heat on shorts. Ultimately, the $443s could be in play if they really push it in the early part of this week.
If the SPY breaks lower and can’t hold $437.57, risk remains to the downside and last week’s low.
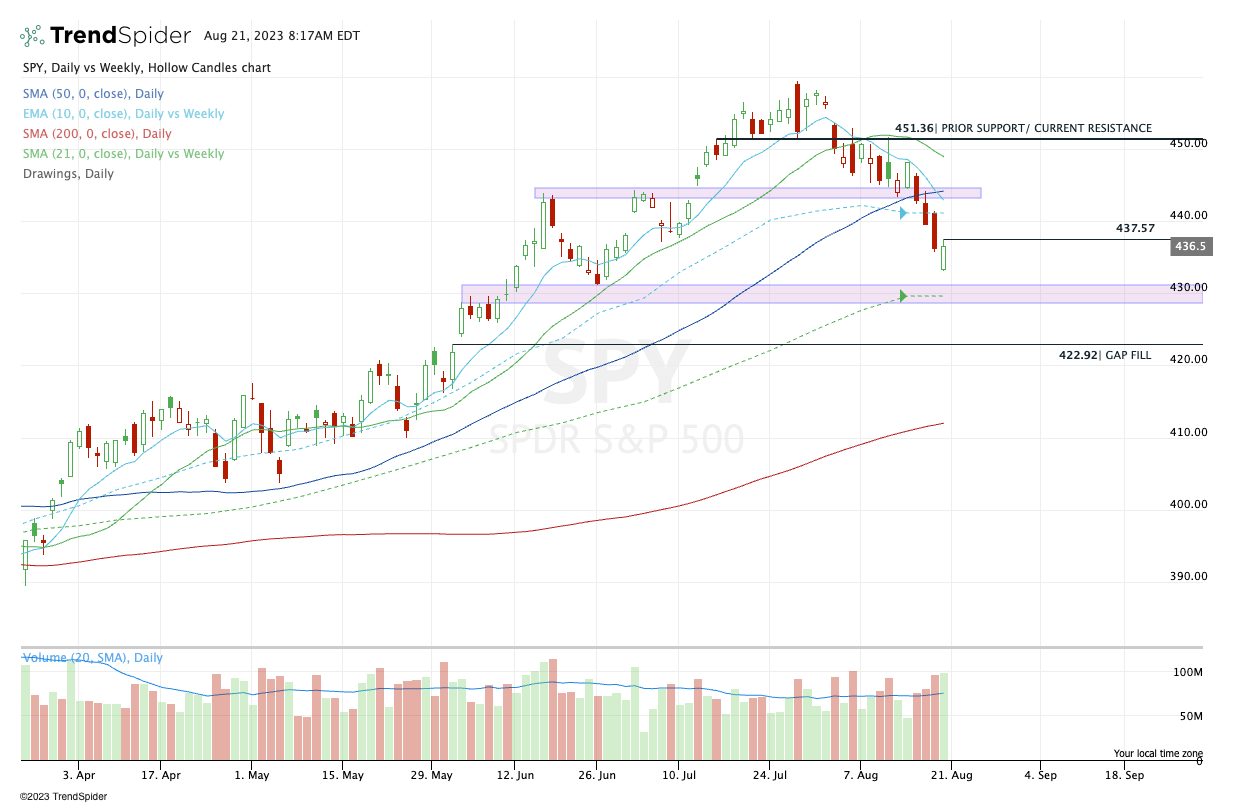
SPY Daily
-
Pivot: $437.57
-
Upside Levels: $440, $441.50 to $442.50
-
Downside Levels: $433, $430-$431
SPX
-
Pivot: 4382
-
Upside Levels: 4400, 4420-25, 4445-50
-
Downside Levels: 4336, 4328, 4300
S&P 500 — ES Futures
We have a nice doji stick from Friday and a daily-up rotation during Globex over 4396. However, the ES is struggling with ~4400.
If we can really hit the gas, it could put the 4435 to 4450 area in play today or tomorrow. If we can’t hold 4396, then 4375, we could revisit last week’s low at 4350.

ES Daily
-
Pivot: 4396
-
Upside Levels: 4407, 4435, 10-day ema, 4450
-
Downside levels: 4375, 4350, 4320-25
If we zoom out to the weekly, let’s open our mind to the idea that we could see a larger correction. One zone that attracts my eye and my style of trading is the ~4200 zone.
That’s a big level of prior resistance as noted on the right chart (the weekly), the 200-day moving average (on the left chart) and right in between the 50% and 61.8% retracements (shown on both charts).
That type of pullback would mark about a 10% decline from the recent high. It won’t likely be a straight drop down — if it occurs at all — but it could be a realistic end point for a much-needed breather amid a seasonally weak two-week stretch.

ES Weekly
NQ
Perfect doji-daily-up development in the NQ. Let’s see if they can jam it over the Globex high currently at ~14,858.

-
Upside Levels: 14,858, 15,000, 15,100
-
Downside levels: 14,725-750, 14,600-610
QQQ
The QQQ bounce trade took on a bigger initial drop than we had expected Friday morning. However, it had a solid close and is gapping higher today. Those who are long via the calls we outlined should consider a nice trim if these gap-up gains hold.

-
Pivot: $359.41
-
Upside Levels: $362.50, $364.50 to $365
-
Downside levels: $357, $354.75
CRM

Quick update on CRM, which gave us a perfect entry off the open (as shown above). We’ve already seen a 25% to 30% gain in the calls.
Look to trim some if we get a nice opening push here. Ideally, we’d play this up toward ~$210 for our first trim, but the QQQ/broader market will dictate its price action.
Open Positions
Bold are the trades with recent updates.
Italics show means the trade is closed.
Any positions that get down to ¼ or less (AKA runners) are removed from the list below and left up to you to manage. My only suggestion would be break-even (B/E) or better stops.
** = previously mentioned trade setup we are stalking.
Down to Runners in GE, CAH, LLY, ABBV, AAPL, MCD & BRK.B. Now Add META, AVGO, UBER, CRM, AMZN, CVS, AMD, TLT and YM.
-
JPM — Many are long from $143-145. This is a longer term swing. Trimmed $153s, then $157.50+ on 7/24.
-
Down to ½ position vs. Break-even stop. Can make small, ~10% position trim if we see $160+
-
-
XOM — long from the monthly-up area at $108.50 — First ¼ or ⅓ trim is ~$112.50. Stops at $104.
-
CRM — long from ~$200 — Trim on any decent gap-up, then look for $208 to $210
-
QQQ — long this week or next week’s $360 calls — Trim ~½ on this morning’s gap-up.
Go-To Watchlist
Feel free to build your own trades off these relative strength leaders
Relative strength leaders →
-
LLY
-
Energy stocks — VLO, SLB, EOG
-
AI stocks — NVDA, ADBE
-
Mega cap tech — GOOGL, AMZN
-
Select retail — ELF, LULU, COST
-
BRK.B (new all-time highs)
-
CAT
-
RCL
Relative weakness leaders →
-
DIS
-
PYPL
-
EL, FL, DG
Economic Calendar
None.
Disclaimer: Charts and analysis are for discussion and education purposes only. I am not a financial advisor, do not give financial advice and am not recommending the buying or selling of any security.
Remember: Not all setups will trigger. Not all setups will be profitable. Not all setups should be taken. These are simply the setups that I have put together for years on my own and what I watch as part of my own “game plan” coming into each day. Good luck!
Update your email preferences or unsubscribe here
© The Opening Print
228 Park Ave S, #29976, New York, New York 10003, United States
No responses yet