Taking profits on a ton of of open positions.
Follow @MrTopStep and @BretKenwell on Twitter and please share if you find our work valuable.
Don’t Forget: The Long-term performance of the S&P 500, some longer-term setups, and 5 red flags that showed up before the 2022 bear market.
Our View
The bear market may not be over, but that’s not stopping bulls from grabbing control of the recent momentum.
In this game, you can do one of two things. You can either be a two-way trader and play both the long and the short side. Or you can stick to one side — either a buyer or a seller.
Over the years, I have seen traders of all sorts who master their preferences. But those that master it, know the trend.
Whether you stick to one side or you play both sides of the field, you must know which direction has the path of least resistance. You can’t be a good two-way trader if you can’t figure out the trend and you can’t be a good bull if you’re always buying in a bear market (or a good bear if you’re always selling in an up-market).
In Yesterday’s Our Lean, I said that I couldn’t rule out an early rally, but that “the ES tends to go sideways to down after a big up-day.”
Well? The SPY and QQQ finished within 0.15% of Wednesday’s closing price. That’s as sideways as it can be. The Russell fell 0.25% and the Dow dropped 0.5%.
As for today, it all hinges on the Jobs report.
Our Lean — Danny’s Take
Economists expect 200,000 jobs to be added in the month of November, which would be the lowest monthly jobs gain in two years.
However, is that still too much for the Fed?
“Chairman Jerome Powell suggested in a speech on Wednesday the economy only needs to add around 100,000 new jobs a month to soak up all the new workers entering the labor force. By that measure, the current pace of hiring is far too strong. It’s adding upward pressure on wages and contributing to persistently high inflation.”
I’m not an economist or a macro-guy; I don’t know what the “goldilocks” number for the jobs report is.
We don’t want a hard landing, but we need a slowdown in the labor market. That’s a tough needle to thread, especially as it takes time to work all the rate hikes through the economy.
Our Lean: The ES bulls still have one job and that’s to hold over multi-week resistance of 4050. Yesterday’s low is 4054. The last two weekly highs are 4050.75 and 4049.25. The 200-SMA is at 4048.
If we see a mild dip down to the level — and Bret will talk about this below — it could give bulls a dip-buying opportunity. If it fails, 4020 could be in play, which is roughly the 50% retrace of the two-day rally and the rising 10-day moving average.
On the upside, a move over 4110 could get us 4135 to 4150.
Our Lean, Our Lean: It’s jobs Friday, but don’t forget, a bullish reaction can turn today from Friday into FRY-day.
MiM and Daily Recap

The S&P had a total trading range of 55.50 points. After a promising PCE reading, the ES opened at 4094.50, traded up to 4110 just after 10:00, then flushed down to an early low of 4054.50 at 10:30.
At 3:50, the ES traded 4085.50 as the 3:50 cash imbalance showed $1.6 billion to buy. It traded 4081 on the 4:00 cash close and settled at 4077.50 on the 5:00 futures close, flat on the day.
In the end, it was an early pop that fizzled out, but the bulls held where they needed to. In terms of the ES’s overall tone, it was flattish after the first 90 minutes. In terms of the day’s overall trade, volume was solid, at 1.77 million contracts traded.
Technical Edge
- NYSE Breadth: 49% Upside Volume
- Advance/Decline: 55% Advance
- VIX: ~$20.25
I’m going to keep it short ahead of the NFP report at 8:30 a.m. ET and may be back for an update later if something notable developments. But for the most part, we have played a damn good round this week and don’t want to force anything on Friday if it’s not a good R/R.
For now though, we continue to take trades, lock in trims and raise our stops. You can see our “Open Positions” tab is littered with the most trades we’ve had on since August. That speaks to the healthier trading environment we’re seeing right now.
I don’t want to put on too many new positions and instead prefer to keep trimming and getting those stops up to breakeven or better. Pat yourself on the back. It’s been a good run.
S&P 500 — ES
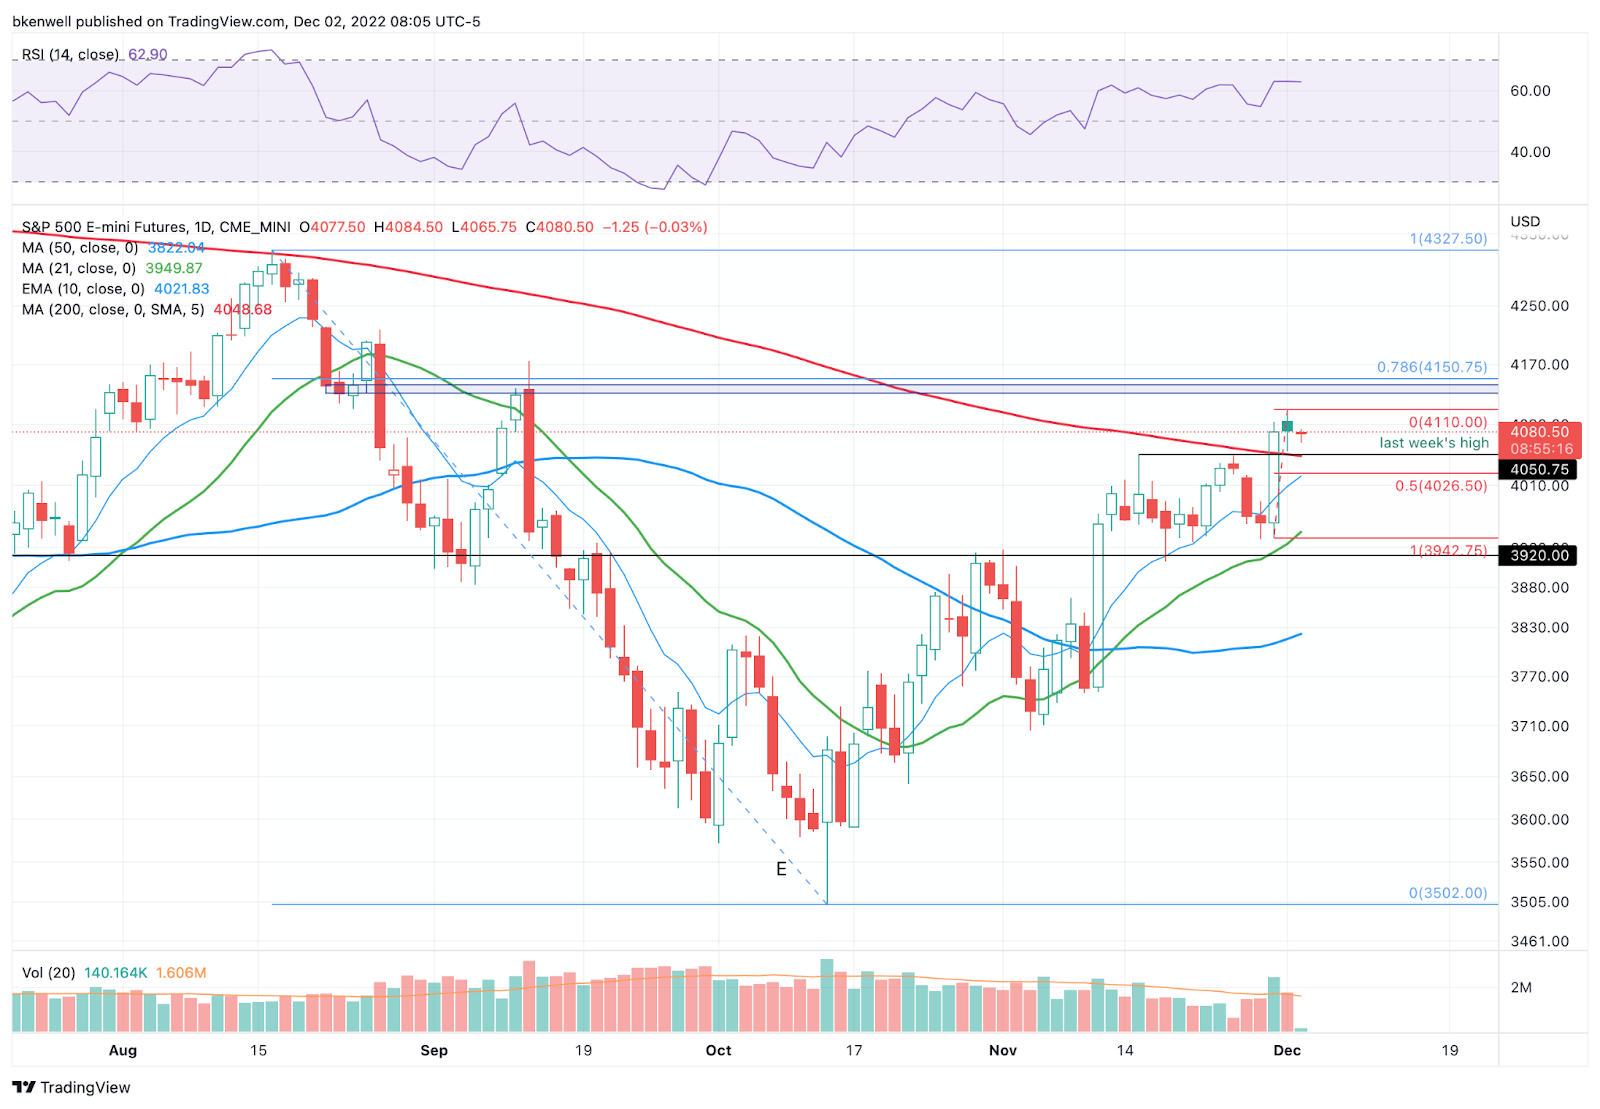
On the daily chart above, you can see where the two significant levels of support reside.
The first is around 4050, which is a multi-week high, yesterday’s low, and the 200-day moving average.
If we get a dip down to this level — say down to 4050 and a quick bounce back up through 4054 (yesterday’s low) — it could give us a bullish reversal to work with.
If 4050 fails as support, it puts 4020 to 4025 in play, where we find the 10-day moving average and the 50% retracement of the recent rally. Below it all puts 4000 on the table.
On the upside, we need a sustained move above yesterday’s high (4110) to continue the rally.
SPY — Daily
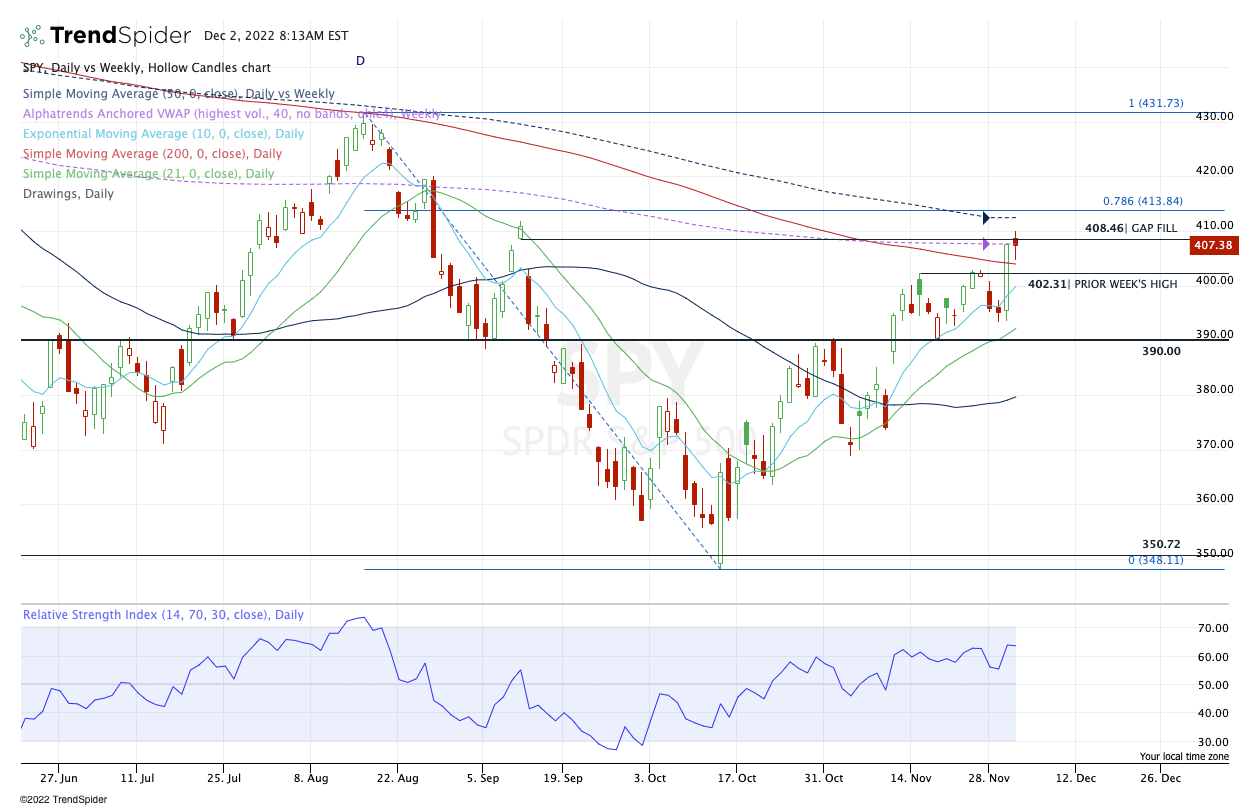
I just want to keep this simple for those holding SPY.
Above $402.30 and the 200-day is healthy action for the bulls. Below the 10-day raises a few questions for the active sequence.
The SPY filled the $408.50 gap and is stalling at the weekly VWAP. It’s looking for direction now.
If it clears yesterday’s high at $410, it puts the 50-week moving average and $414 area in play.
TLT

The TLT has treated us marvelously over the past weeks. If you want to cut down to ½ position ahead of NFP, I can’t blame you. I certainly want to be down to ½ or ⅓ if we see $106 to $108.50, where TLT starts to run into some weekly measures, as well as the 50% retracement.
Go-To Watchlist
*Feel free to build your own trades off these relative strength leaders*
- Numbered are the trades that are open.
- Bold are the trades with recent updates.
- Italics show means the trade is closed.
Open Positions —
- TLT — Long from ~$97, reloaded at $101.50. Now trimmed ⅓ over $104 yesterday. I want to be down to ½ or even ⅓ after yesterday’s move.
- CCRN — down to ⅓ or less. Exit at $36+ or consider holding for $37.50 to $38. Stop raised to $34.
- DIA — Reloaded on the daily-up over $339.37. Trim ½ over $346 if you did not trim yesterday. Let’s fish for $349 to $350 before the next trim.
- B/E stop
- Gold — Exit the rest if still holding. A monster trade I wish that we did not cut down prematurely.
- TJX — Long from ~$79. Trim at $81. Stop at $78.50 (No need to let it unravel too far against us). Great reaction from the 10-ema.
- IBM — Daily-up over $147.17 was the entry. $145.50 is our stop. Trimming ⅓ at $149.50+ (pre-market is fine). Ideally down to ½ if we see new highs over $150.50.
- Stop at $145.50 or B/E for less aggressive traders
- WMT — “For those “still fishing” let’s see if we get a true tag of the 10-day.” Long from $151.
- Trimmed ⅓ at $153.25. I am going to say B/E stop and trim down to ½ if we see $154+
Relative strength leaders →
- LNG
- CAH
- Retail — TJX, WMT, ULTA
- SBUX
- DE
- CCRN
- AMGN
- MET
- GIS
- REGN
- CI
- MCD
- ENPH, FSLR — solar has strength
- VRTX
- UNH
- MRK
- XLE — XOM, CVX, COP, BP, EOG, PXD (Weekly Charts)
Economic Calendar

Comments are closed