The bulls did the heavy lifting yesterday.
Follow @MrTopStep and @BretKenwell on Twitter and please share if you find our work valuable.
Don’t Forget: The Long-term performance of the S&P 500, some longer-term setups, and 5 red flags that showed up before the 2022 bear market.
Our View
I figured we would break out of the narrow trading range but in all honesty, I didn’t think the ES was going to rally to 4093 in just a few hours. However, it makes sense when you consider the number of stops that were accumulating below support and above resistance.
One of those was set to break and once it happened — in this case to the upside — it triggered an avalanche of buy-stops. It’s why our charts outlined a plan of waiting for a range break. Once the S&P took out the prior day’s high, it was off to the races toward the prior week’s high.
That said, I have to be honest too.
I got out of my long ES at 3968 early on Globex. I had family stuff I had to do. When I came back and the ES was taking out 3990, it was not hard to see that — based on the NQ — the ES was going a lot higher.
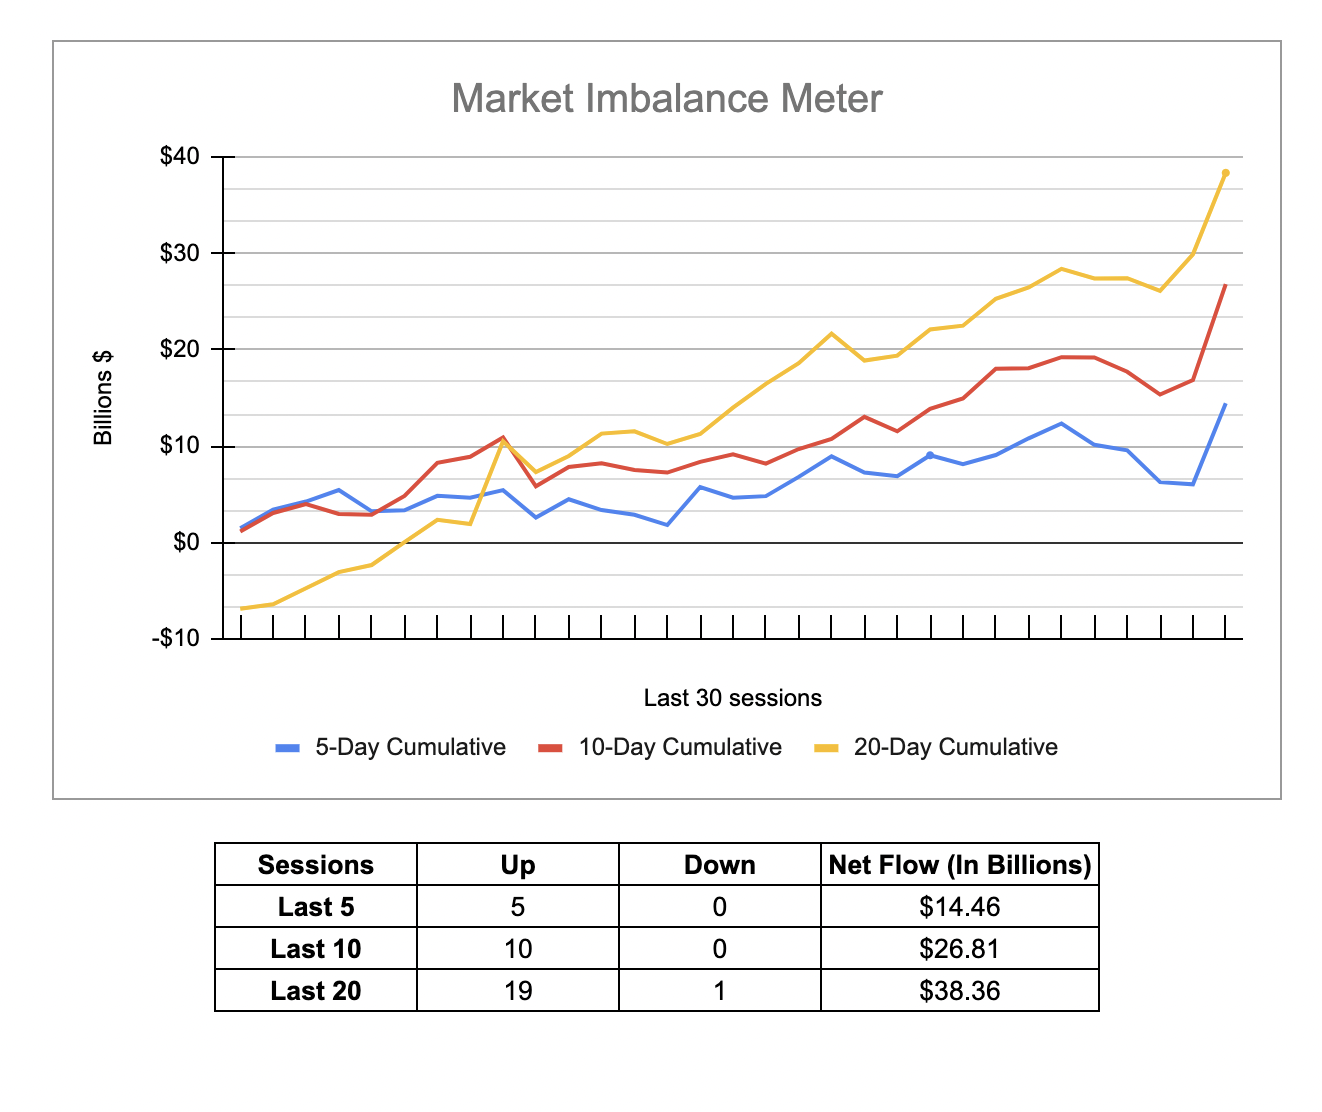
Another thing. The MIM chart is below. It shows “where the money flow” has been going for the last week (5 sessions), the last two weeks (10 sessions), and the last month (20 sessions). Anyone who says the MIM — or MOC orders, (market on close) — means nothing, knows nothing. Look at where the money has been flowing and then look at what the S&P has been doing. I don’t know anyone else who provides this information, so use it to your advantage.
Our Lean — Danny’s Take
When the ES rallies 150 handles in 4.5 hours, there is no way all the shorts got out. When that happens, traders have three choices: Hold, roll the position higher or get out. I think yesterday was the latter.
Our Lean: I can’t rule out a rally this morning, as there may still be upside momentum left since the rally took place late in the afternoon, but I have to go with the MrTopStep rule that says “the ES tends to go sideways to down after a big up-day.” I am not saying we will see this, but the 50% retracement of yesterday’s day range is 4022.
MiM and Daily Recap
The ES traded 4067.25 as the 3:50 cash imbalance showed an amazing $11.1 billion to buy and traded 4082 on the 4:00 cash close. In the end, you can say but that $11.1 billion to buy was why the markets rallied so much. Sure the shorts were stuck, but I said a few days ago big things happen at the end of November. In terms of the ES’s overall tone, it was dead in the first four hours, but once those Powell headlines hit it was game on. In terms of the ES’s overall trade volume was big at 2.35 million contracts traded.
Technical Edge
- NYSE Breadth: 90.7% Upside Volume (!!)
- Advance/Decline: 85.8% Advance
- VIX: ~$20.50
A “90/90 day” happens when we have 90%+ upside breadth and 90%+ advancers. These days are rare but can often mean that the low is in. At the very least, it marks a huge return in demand and can give us a low to trade against.
Because the rally didn’t start until after 1:30 yesterday, we didn’t get a 90/90 day. Instead, we got a 90/86 day. But I just want you to keep that in mind going forward and why a 90/90 day is relevant.
That said, yesterday was stunning. We got the rotations setups we were looking for. While we had to take on risk, we did so in a prepared and measured manner and now we are getting paid for it. Updates on open positions are below.
Today’s PCE number is important — in regards to the Fed — and Friday’s jobs number is critical as well. So keep those in mind as well.
S&P 500 — ES

Using the weekly chart for the ES, you can see how the S&P held key support and rotated through two weeks’ worth of highs.
You can also see how that opens the door up to the 4150 area, where we find the 50-week moving average and the 78.6% retracement. For now, that’s my aim, even though the caveat here is the PCE data and the jobs report.
On the downside, bulls have one job today: Hold 4050.
SPY — Daily

Now that’s what I call a statement. The SPY ripped through the 200-day moving average and the last two weekly highs near $402.30. It even charged toward the $408.50 gap-fill level and the weekly VWAP measure.
If it continues higher, $413 is next. There we find the 50-week moving average and the 78.6% retracement.
On the downside, bulls need to hold the 200-day and $402.30.
Dow

“Daily-up over $339.37 could put the bull trade back in play.”
That triggered nicely and now we are certainly taking profits after such a big move yesterday. Down to ½ here and maybe look for $350-ish next.
TLT

“I want to see how it handles a dip to the 10-day ema, which it has not tested in 13 sessions.”
Yesterday was a day with risk, but those that took it are being paid handsomely. As noted yesterday, we were looking to “refill” and we got the dip to the 10-day.
Now trim any move over $104, at least by ⅓.
Over $103.81 and we have a monthly-up rotation in play.
Go-To Watchlist
*Feel free to build your own trades off these relative strength leaders*
- Numbered are the trades that are open.
- Bold are the trades with recent updates.
- Italics show means the trade is closed.
Open Positions —
- TLT — Reloaded our position to a full position on yesterday’s dip to the 10-ema. Now trim at least ⅓ on any push over $104.
- CCRN — down to ⅓ or less. Exit at $36+ or consider holding for $37.50 to $38. Stop raised to $34.
- QQQ — Just down to runners. — exit the rest
- DIA — Reloaded on the daily-up over $339.37. Trim ½ over $346 if you did not trim yesterday. Let’s fish for $349 to $350 before the next trim.
- Gold — Exit the rest if still holding. A monster trade I wish that we did not cut down prematurely.
- TJX — Long from ~$79. Trim at $81. Stop at $78.50 (No need to let it unravel too far against us). Great reaction from the 10-ema.
- IBM — Daily-up over $147.17 was the entry. $145.50 is our stop. Trimming ⅓ at $149.50+ (pre-market is fine). Ideally down to ½ if we see new highs over $150.50.
- WMT — I personally missed WMT yesterday. For those that didn’t, trim $153.50 to $154. For those “still fishing” let’s see if we get a true tag of the 10-day. Needs to hold $150
Relative strength leaders →
- LNG
- CAH
- TJX
- SBUX
- DE
- CCRN
- AMGN
- GIS
- REGN
- CI
- MCD
- ENPH, FSLR — solar has strength
- VRTX
- UNH
- MRK
- XLE — XOM, CVX, COP, BP, EOG, PXD (Weekly Charts)
- SBUX
Economic Calendar

Comments are closed