Follow @MrTopStep and @BretKenwell on Twitter and please share if you find our work valuable.
Our View
I guess if you’re a stock market optimist, bailing out Credit Suisse is a bullish idea but when you look at the long history of the billions already lost and all the mistakes, it can’t be a good idea. Just look at the poor track record of the banks and tell me how the mistakes of the past won’t be repeated. Look at Credit Suisse’s track record:
-
2009: Fined $536 million for bypassing US sanctions
-
2014: Fined $2.6 billion for evading US taxes
-
2021: Lost $5.5 billion due to risky exposure to Archegos fund failure
-
2021: Froze $10 billion in funds due to Greensill collapse
-
2022: Pleads guilty to defrauding investors over $850 million loan, fined $475 million
-
2023: Delays annual report to address accounting concerns from the SEC
-
2023: Saudi National Bank said they won’t provide further financial support
-
2023: US Treasury and ECB announce they are monitoring CS situation Now, Credit Suisse is asking the Swiss Central Bank for support. Their Credit Default Swap premiums are trading above 2008 levels
I know many wanted to repeal some of the banking regulations currently in place, but it’s a good thing this is (so far) a regional banking issue and not a major banking issue. If this was BofA instead of SVB Financial, the ES would look a whole lot worse right now.
So what does “too big to fail” mean? It means that despite never getting it right and blowing up everything it’s touched over the last 14 years, you can remain in the game. This looks like nothing compared to the subprime crisis in 2008 when Bear Stearns and Lehman Brothers folded, but my question is how long can this type of stuff go on?
Our Lean
Despite the recent moves in the 2 year note, ECB policy makers are still leaning towards a .50% point rate hike today, as the euro zone economy is picking up strength and inflation is set to remain too high for years. Next week the Fed is also going to raise interest rates, but some feel they should be lowering — or at least pausing — not raising.
Can it push the stock market up temporarily? Sure. However, I don’t think this is going to reverse the stock market’s downward trend.
Friday is the March Triple Witching expiration, so let’s get to that before we get to today’s lean. According to the Stock Trader’s Almanac, Friday’s expiration day has been mixed over the last 30 years.
On the plus side, the Nasdaq has been up 7 of the last 8 occasions. And according to the Ned Davis S&P cash study, the week after the March Triple Witch says March ends weak.
Our Lean: Tuesday’s 3:50 cash imbalance was $4.3 billion to buy and the ES rallied hard on the close, but got bushwhacked by the Credit Suisse news overnight and then rallied hard again on yesterday’s close when the imbalance showed $4.4 billion to sell.
Obviously today, the ECB rate hike will come into play and likely drive European markets. By the way, the DAX is down 1000 points from last week’s high. Our Lean is to go slow while the markets are thrashing. 3850 was basically where the ES started out the year and it has acted as a good buy area so far. So we are just going to play the levels until they fail.
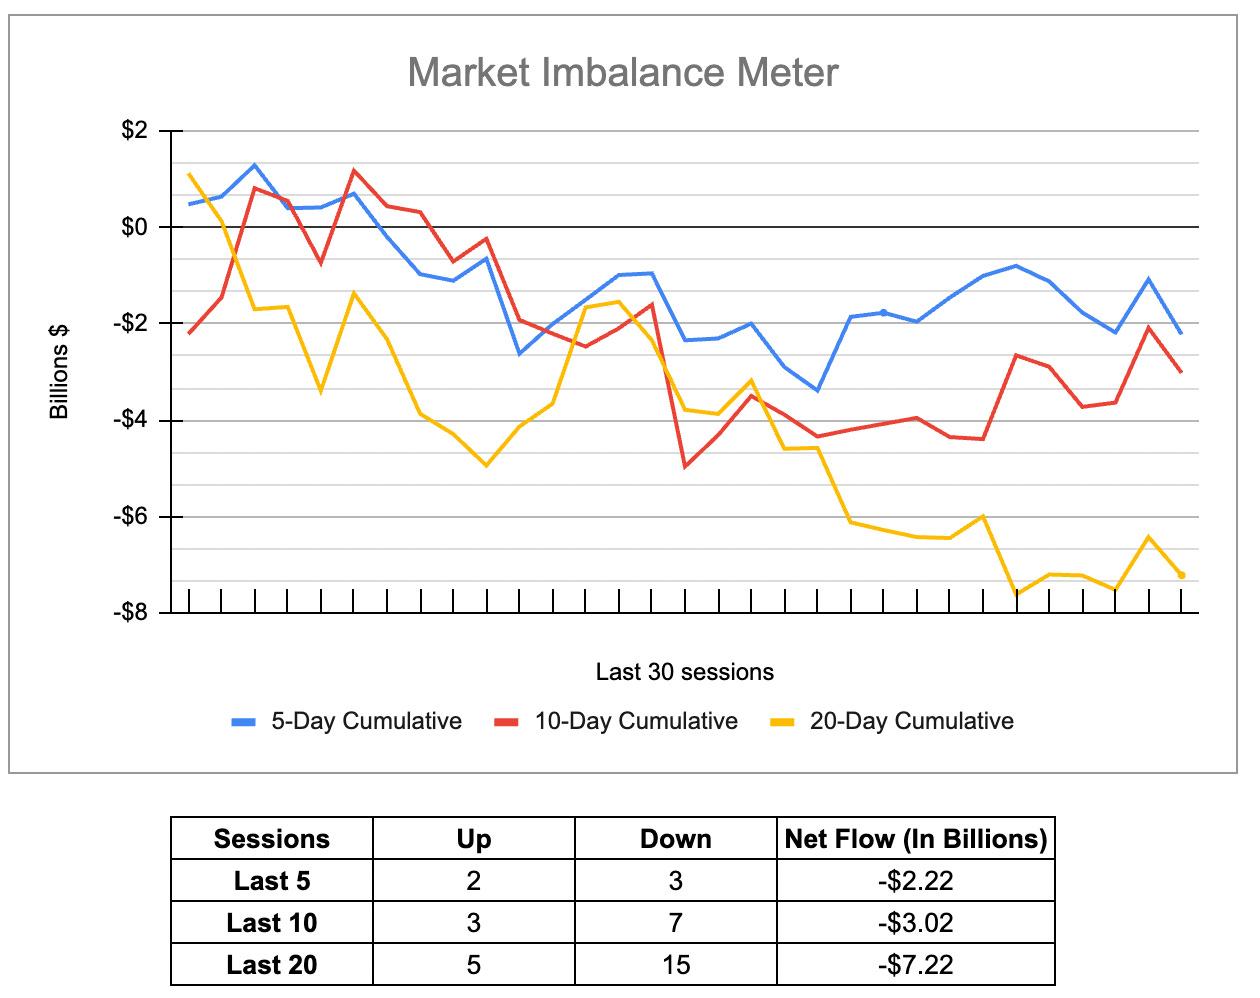
MiM and Daily Recap
The MiM has clearly favored the downside over the last week, two weeks and month.
The ES traded up 3964 on Globex and opened Wednesday’s regular session at 3890.75. After the open, the ES traded up to 3909.75, fell to 3975.00 going into 11:00 and “quickie rallied” 20.50 points up to 3906.75 at 11:21, then fell back down to 3869.50 at 1:00. After the low, a headline hit about a possible Swiss bailout for CS and the ES traded up to 3899 and then dropped down to the 3885 area. It then rallied all the way up to 3928.50 and sold off down to the 3907 area.
At 3:25 the ES traded 3924.50 as the early imbalance showed $950 mil to sell. The ES then sold off down to 3908.75 as the 3:50 cash imbalance showed $4.2 billion to sell, traded down to 3901 and then rallied up to 3928.50 on the 4:00 cash close. After 4:00, the ES pulled back down to the 3921 area and settled at 3925.50 on the 5:00 futures close, down 29.5 points or -0.75% on the day.
In the end, it was a treacherous trading day. In terms of the ES’s overall tone, it was weak until the Credit Suisse headlines hit and the futures rallied. In terms of the ES’s overall trade, volume was high at 2.95 million contracts traded.
Technical Edge —
-
NYSE Breadth: 20% Upside Volume
-
Advance/Decline: 22.5% Advance
-
VIX: ~$26.75
Just a bit of personal advice: Take time to unwind. Specifically this weekend, but in general as often as reasonably possible.
The last 7 days alone featured a bank failure late last week, then another over the weekend. It had the all-important CPI reading on Tuesday, the PPI and retail sales on Wednesday, worries over European banks and now Opex on Friday.
With the extra volatility, we need to remember to enjoy some extra R&R, because mental capital can burn up too — then comes the account capital.
S&P 500 — ES
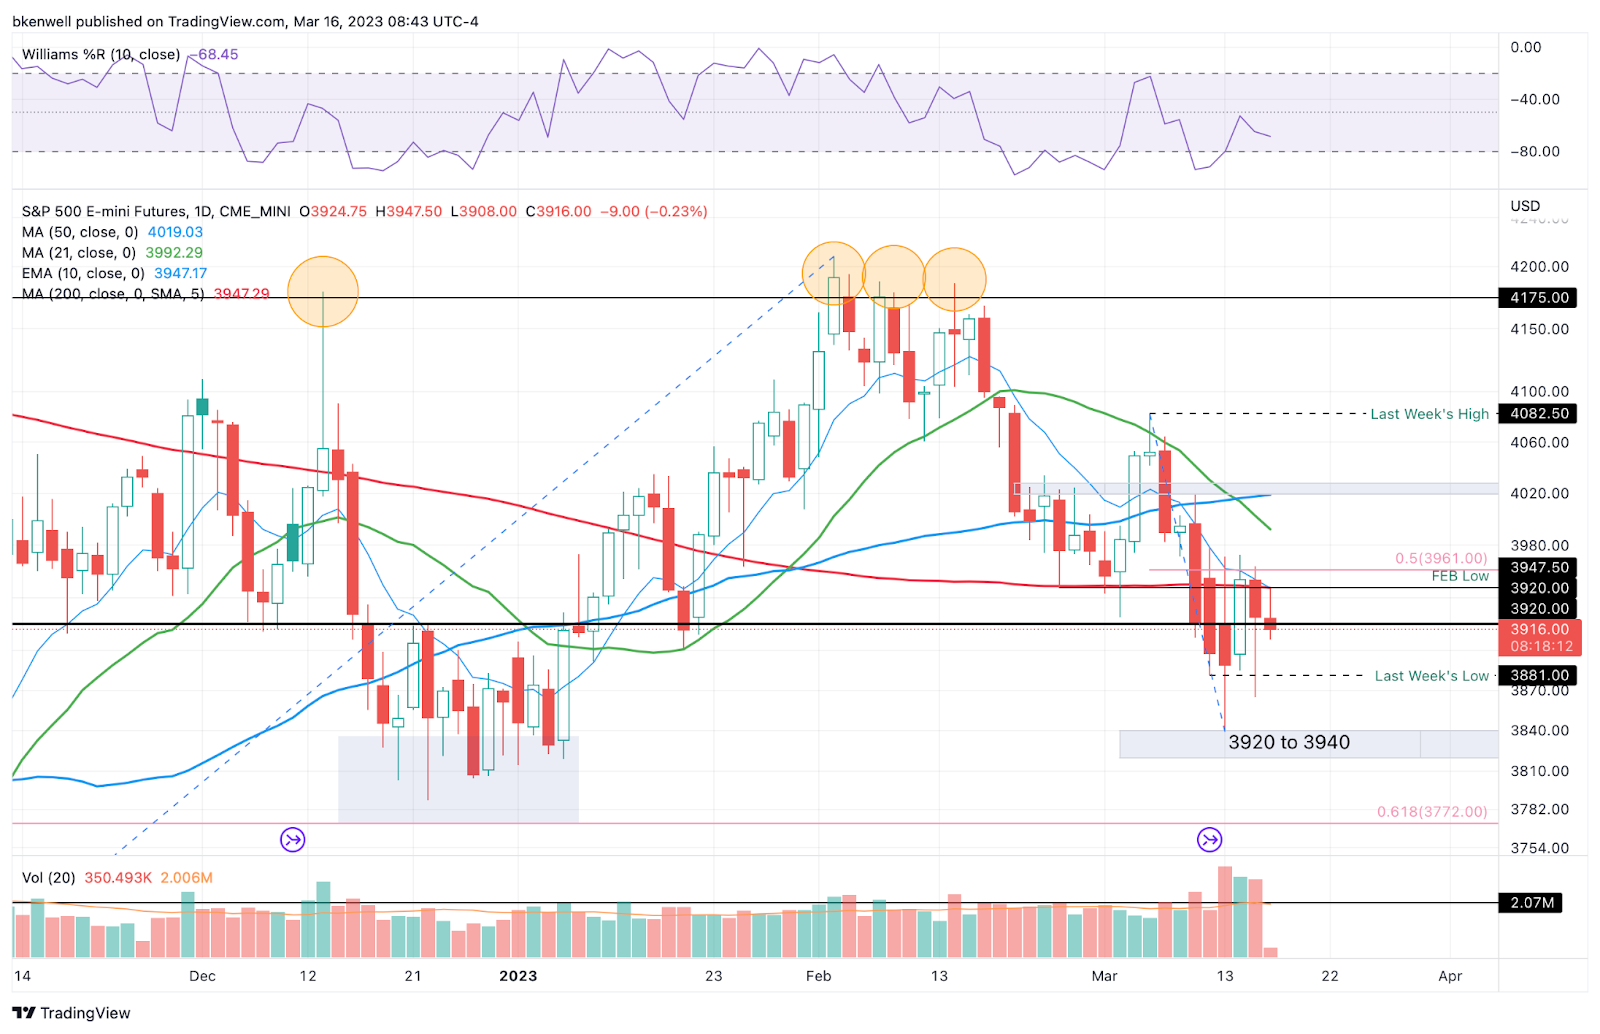
The ranges are back and I’ll just say this: The NQ and more specifically, FAANG + NVDA, TSLA and MSFT are flexing some muscles and holding a lot of this up.
Overnight, the ES traded back up to our key 3947 to 3960 and is being rejected. No surprise there. That’s the 10-day and 200-day moving averages and the February low.
This zone must be reclaimed for the bulls to make a strong case for 4000.
-
Upside levels: 3947 to 3960, 3990.
-
Downside levels: 3900 to 3910, 3880, 3860.
SPY
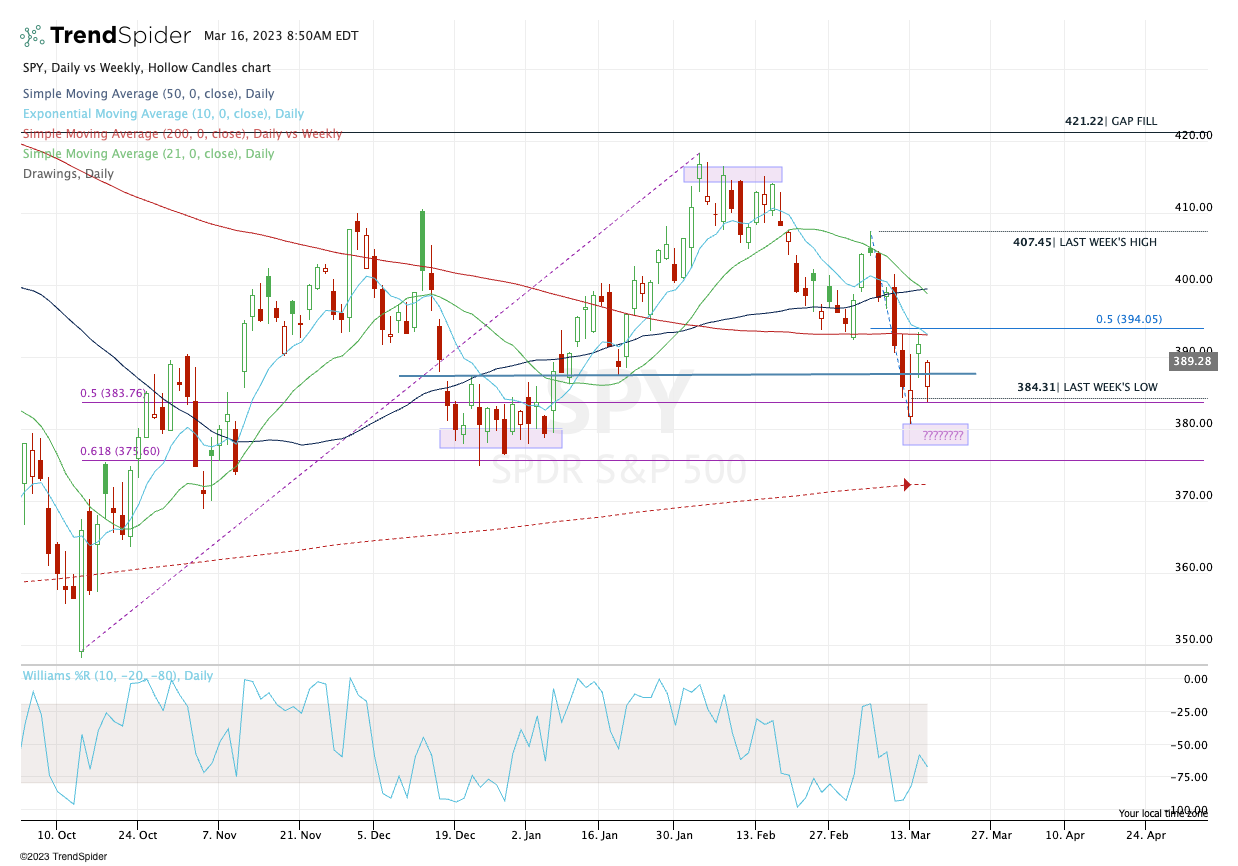
Daily chart above, 4-hour chart below.
-
Major upside level: $393 to $394.
-
Major downside level: $387.50, $384-85
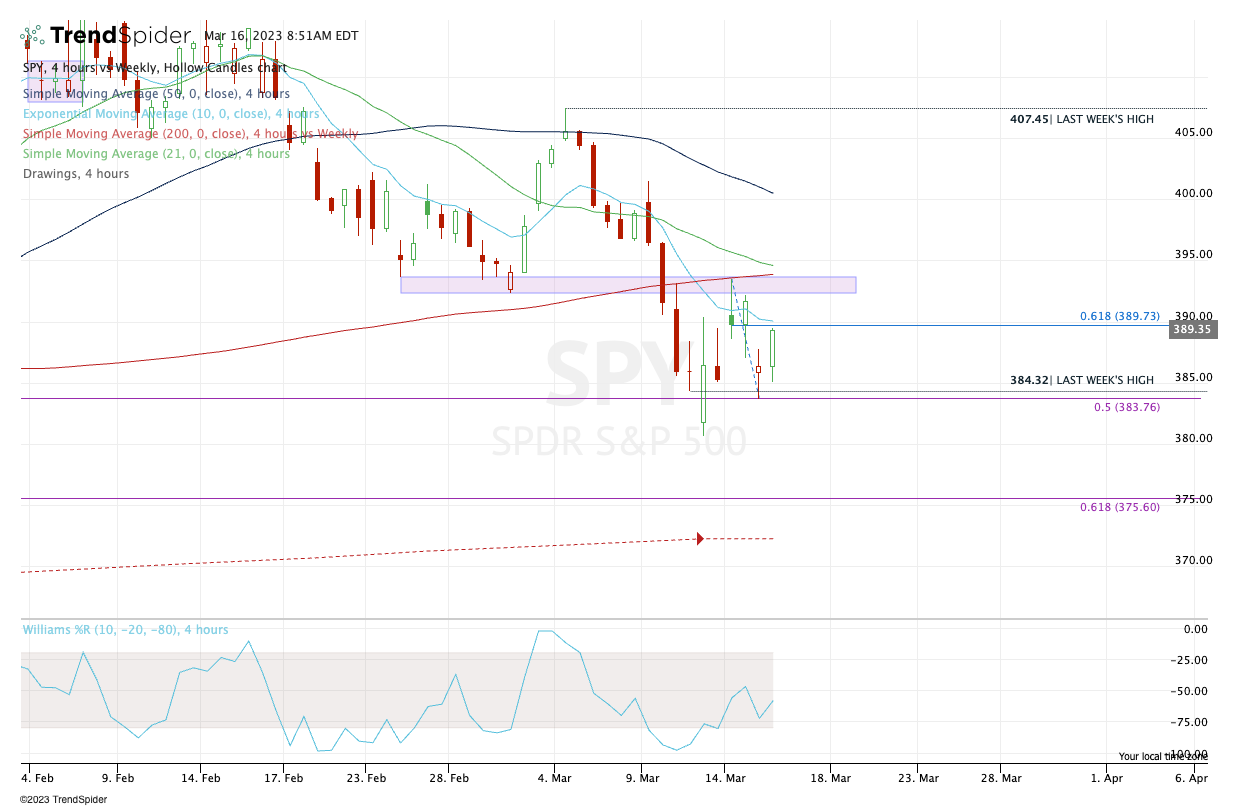
On the upside, keep an eye on the $390 level.
That has been a key pivot level in the past, but it’s also the 61.8% retrace of the two-day range, the declining 10-ema and near yesterday’s HOD.
Open Positions
-
Bold are the trades with recent updates.
-
Italics show means the trade is closed.
-
Any positions that get down to ¼ or less (AKA runners) are removed from the list below and left up to you to manage. My only suggestion would be B/E or better stops.)
-
** = previous trade setup we are stalking.
-
MRK — Long from ~$110 and (disappointing action as it was oh-so-close to our first target, missing by a few dimes) — Ideal stop is clearly defined near $105. Initial target for ⅓ trim is $112.50.
-
Natural Gas, UNG or /NG — First target hit at UNG ~$10 and NG at 2.95 to 3.00.
-
Now /NG needs to hold the $2.40 to $2.50 mark in order for bulls to stick with this one.
-
Trim NG at $2.80 to $2.90. UNG at $9.25
-
-
GE — long from $90.75 on the daily-up rotation — Hit our first target at $92 and some of you probably got off more at $93+ (technically about 10 cents shy of the $93.25 target).
Go-To Watchlist
*Feel free to build your own trades off these relative strength leaders*
Relative strength leaders →
-
FSLR
-
NVDA, CRM
-
PANW, FTNT
-
AVGO
-
GE
-
AQUA
-
TSLA
-
WYNN, LVS → would love a reset to the 10-week ema
-
SBUX, ULTA
-
AEHR → volatile!
-
MELI
-
BA
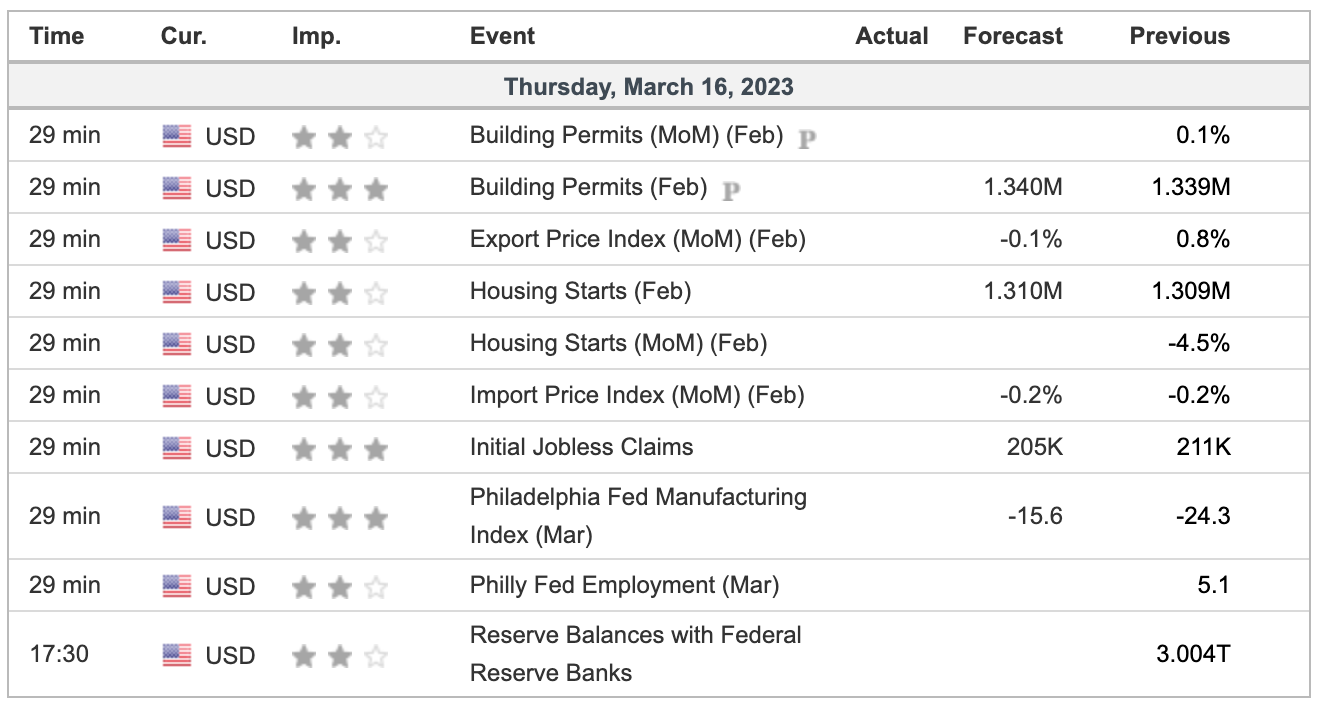
Economic Calendar
No responses yet