Follow @MrTopStep and @BretKenwell on Twitter and please share if you find our work valuable.
Our View
Behind the Fed and all the recent noise:
JPM calculated CTAs had 300B worth of rate shorts across USTs, Bunds and Gilts & covered two-third. “The past 3 days have seen the greatest short-covering in rates since the pandemic or March ’20. This means another 100B of shorts in rates are still left to be covered.” Jef Evening Scan
Equity Liquidity: Record volumes do not equal liquidity. S&P 500 futures liquidity is $2.0M. This is the lowest level since March 30th, 2020 (Covid times). At the start of March 2023, you could trade $17M on the screens, and today is $2M, a decline in 88%.”
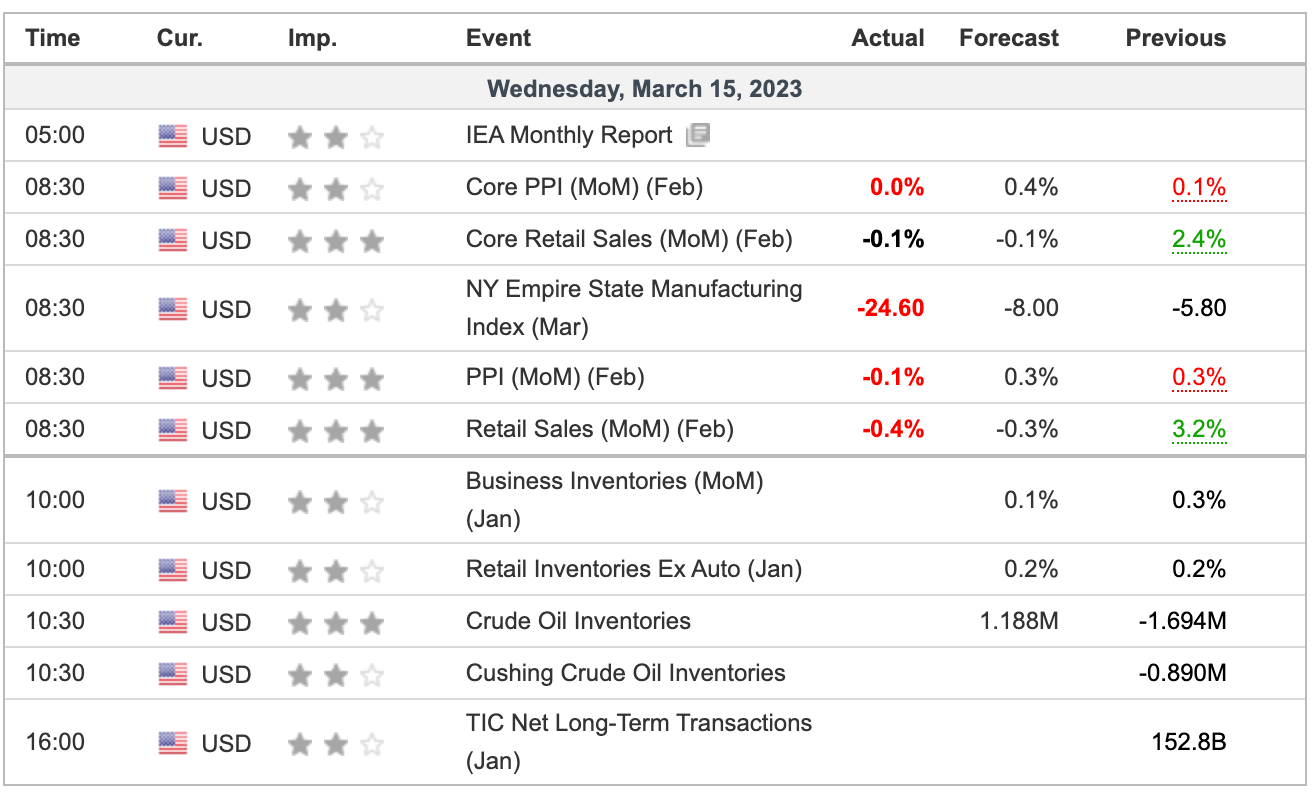
This week is no walk in the park. We had the weekend panic and I’m still sure that that situation has not run its course yet. Tuesday featured in-line CPI results and Wednesday morning features the PPI and retail sales report.
Now, fears of European banks are creating some selling pressure.
Our Lean
Volatility has taken a major spike higher. Even though the VIX fell about 10% on Tuesday, it still closed near $24 and is up over 25% from Thursday’s low. Now it’s $28+ this morning.
When we look at the daily chart of the S&P 500, selling the “high risk/reward” spot was the play. That was $SPY $393.50 to $394 and /ES 3950-3960.
BlackRock’s Larry Fink said that the Fed’s rate hikes have “exposed cracks in the financial system.” That manifested in US regional banks late last week and now that fear is spreading to the European banks.
Several European banks have been halted limit-down after Credit Suisse shares plunged over 20% as Saudi National Bank rules out providing further assistance to the troubled lender.
As of 8:00 a.m. ET:
-
Credit Suisse is down 24%
-
Societe Generale is down 12.5%
-
BNP is down 11%
-
Commerzbank is down 10.5%
-
Deutsche Bank is down 8.5%
-
UBS is down about 7.5%
Notably, many of these banks are trading right down to their 200-day moving averages. However, technicals are not here to save the day in these types of scenarios.
This is what you call contagion. People chuckled when I said we were going into a new credit crisis and we are. It’s not 2008, but there’s more to this story.
Our Lean: As always, I can’t rule out a bounce but…sell all rallies. You know the drill…Levels on charts below!
MiM and Daily Recap
The ES traded up to 3944 on Globex and traded 3942.25 on Tuesday’s regular session open. After the open, the ES continued to push higher, rallying all the way up to 3972.50 at 11:25. After the high, a headline hit saying that a Russian jet hit a US drone. The S&P petered out and turned south, trading 3921.50 at 1:15 and bounced back up to 3942 at 1:40.
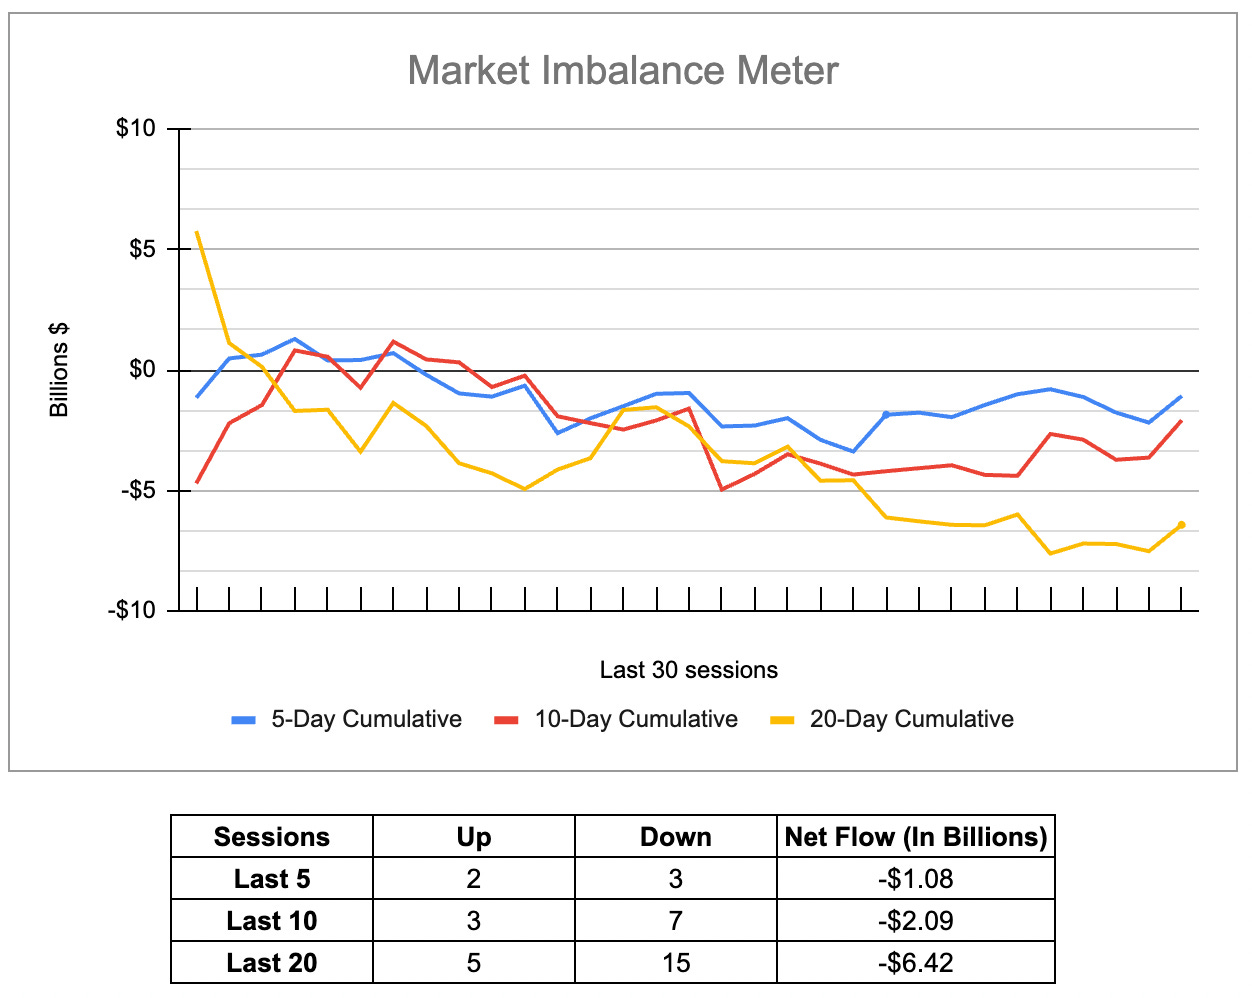
After the pop, the ES sold back off down to 3913.25, rallied up to a lower high at 3936.25 and then puked back down to 3910 at 3:15. Ultimately, the ES bottomed at 3905.50 then bounced hard into the reveal, trading 3937.50 as the 3:50 cash imbalance showed $550 million to buy, which quickly ballooned to more than $4 billion to buy.
I traded 3957.50 at 3:59 and 3952.50 on the 4:00 cash close. After 4:00, the ES settled at 3955 on the 5:00 futures close, up 60 points or 1.54% on the day.
In the end, the bears got squeezed out during the rally and the longs got shook out on the decline. In terms of the ES’s overall tone, there was big two-way flow until the oversized buy imbalance pushed the ES higher into the close. In terms of the ES’s overall trade, volume was oversized at 4.54 million, which included all the ESH/ESM spreads amid the contract rollover.
Technical Edge —
-
NYSE Breadth: 70% Upside Volume
-
Advance/Decline: 76% Advance
-
VIX: ~$27.50
The PPI report came in soft and the market saw a bit of an uptick on that note. And while it is a positive, there are bigger fish to fry right now (not to mention the in-line CPI report from yesterday).
When the VIX rallies 50%+ in two days, bond yields go haywire, gold jumps and the regional banking ETF suffers a peak-to-trough decline of 31% in a week, it will take some time for the system to absorb this extra wave of volatility.
S&P 500 — ES
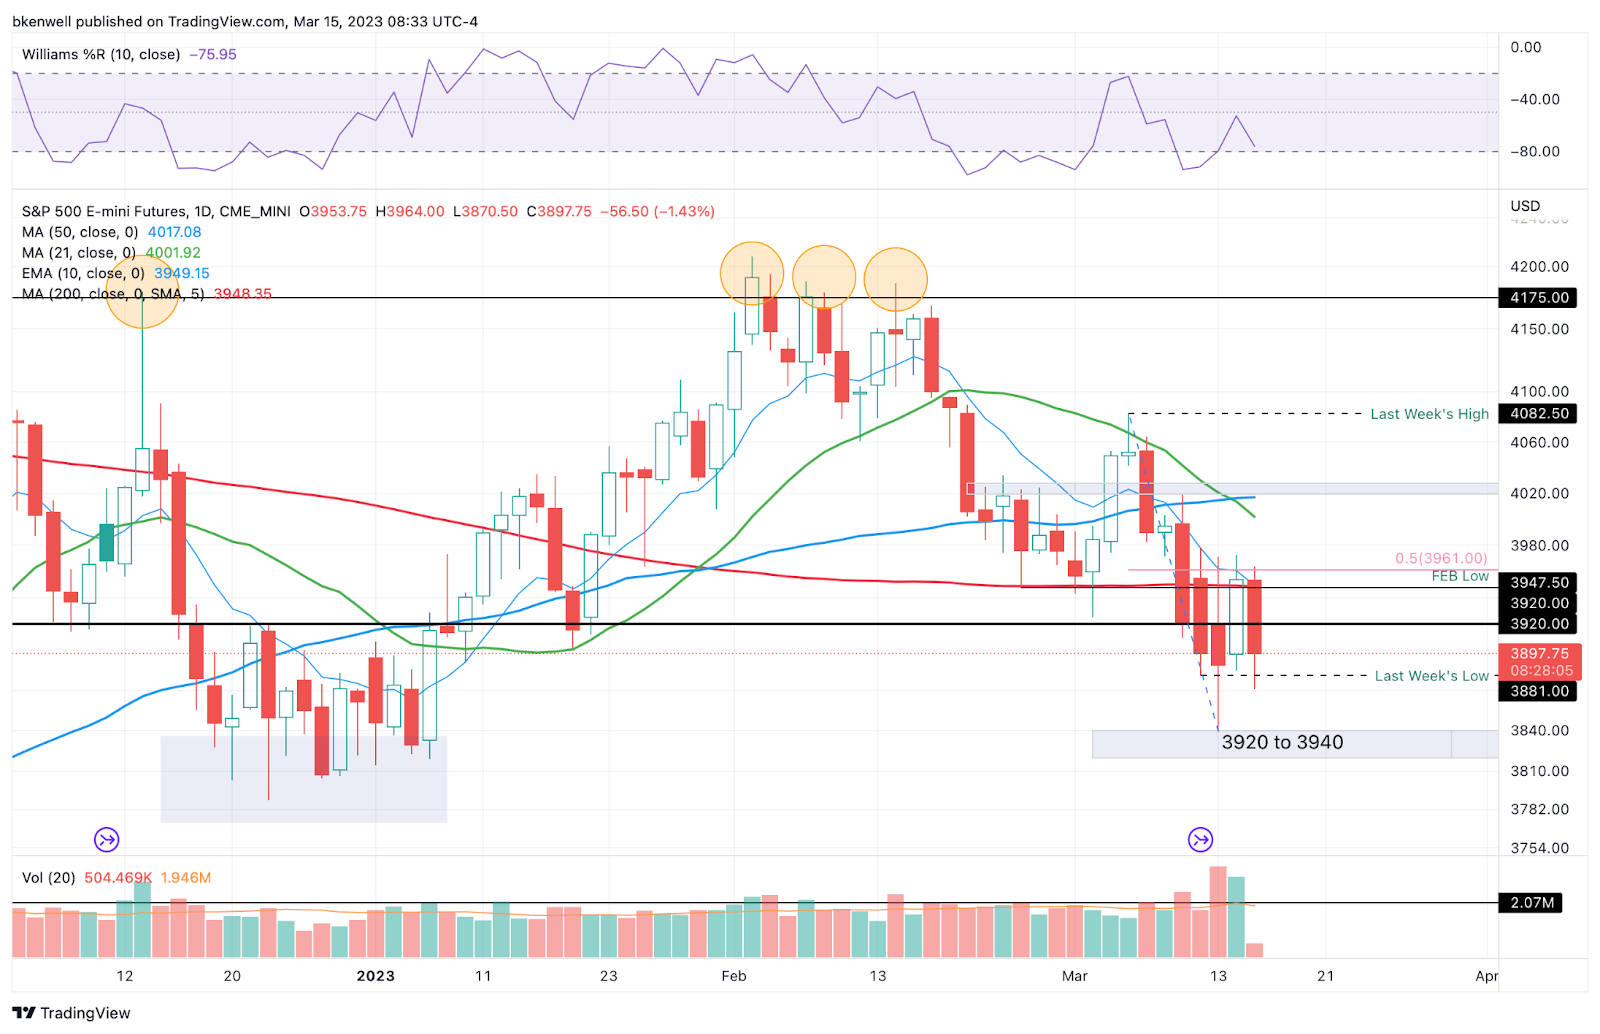
The ES overshot our 3947 to 3960 zone by 10 points, but it was the right location to be a seller. Look, when the VIX is $25+ the ranges are going to be extended a bit.
Of course, no one knew that we’d wake up this morning and European banks would be the problem. But the charts outlined why this was resistance. It was the 50% retracement, 200-day and 10-day moving average and the February low.
Take a moment and observe how much overhead support is now building between 3950 to 3975.
The Trade: 3880 is critical. It’s been support lately and it’s last week’s low. Weekly-down would open the door back down to 3840, (the top of our support zone between 3820 to 3840).
If we lose 3800, 3770 to 3775 is in play — the 61.8% retrace of the rally off the Oct. low.
On the upside, 3910 is resistance. Followed by 3933 and 3950-3970.
SPY

You can see where resistance was going into yesterday’s highs. While a late-day rally saved the SPY, it’s no question why we were sellers near $394. Too many overhead resistance measures were in the way.
Now gapping lower on the day Cover ⅓ to ½ of the trade.
Let’s see if we can’t get a retest of this week’s low under $381. The $377 to $380 is important for bulls to hold.
Closing weekly-down below $384.31 is not bullish at all.
Bonds — TLT
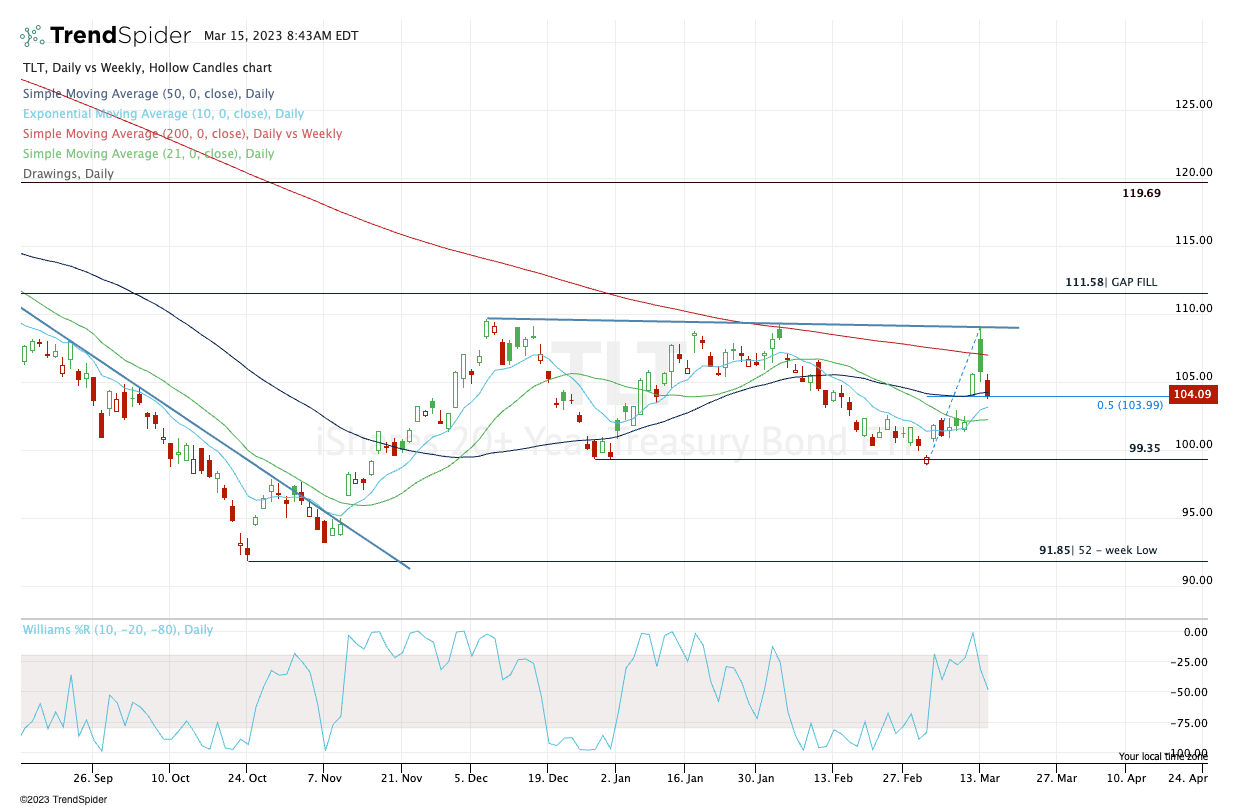
Bonds were leading the way down just a few weeks ago, but a renewed fear in financial assets has created demand for safe havens.
Gapping higher on the day, let’s see how the TLT handles the $109 area. It marks Monday’s high, but multi-month resistance. Quarter-up over $109.68 could trigger a much larger move in the ETF.
Open Positions
-
Bold are the trades with recent updates.
-
Italics show means the trade is closed.
-
Any positions that get down to ¼ or less (AKA runners) are removed from the list below and left up to you to manage. My only suggestion would be B/E or better stops.)
-
** = previous trade setup we are stalking.
-
MRK — Long from ~$110 and (disappointing action as it was oh-so-close to our first target, missing by a few dimes) — Ideal stop is clearly defined near $105. Initial target for ⅓ trim is $112.50.
-
Natural Gas, UNG or /NG — First target hit at UNG ~$10 and NG at 2.95 to 3.00.
-
Now /NG needs to hold the $2.40 to $2.50 mark in order for bulls to stick with this one.
-
Trim NG at $2.80 to $2.90. UNG at $9.25
-
-
GE — long from $90.75 on the daily-up rotation — Hit our first target at $92 and some of you probably got off more at $93+ (technically about 10 cents shy of the $93.25 target).
-
Can use $90 as a stop-loss. Target $93.25 to get down to ½, then $94+ to get down to ⅓.
-
Go-To Watchlist
*Feel free to build your own trades off these relative strength leaders*
Relative strength leaders →
-
FSLR
-
NVDA, CRM
-
PANW, FTNT
-
AVGO
-
GE
-
AQUA
-
TSLA
-
WYNN, LVS → would love a reset to the 10-week ema
-
SBUX, ULTA
-
AEHR → volatile!
-
MELI
-
BA
Guest Post
Topic: PTG Taylor 3-Day Cycle
Author: David D Dube’ (a.k.a. PTGDavid)
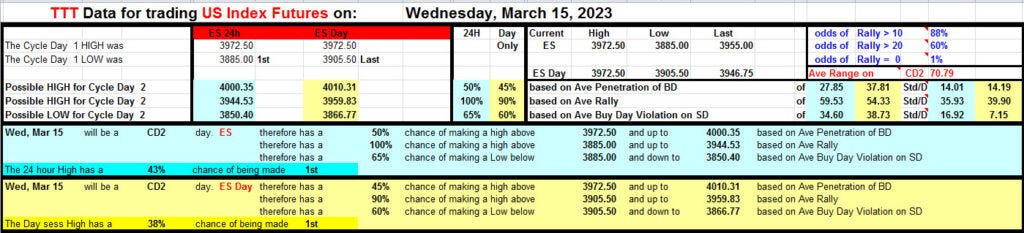
Prior Session was Cycle Day 1 (CD1): Price established a cycle low @ 3885 during a volatile CPI release. Once the market stabilized, firm bids pushed price higher to fulfill key 3-Day Cycle Target @ 3960, as well as Target Master (3965 – 3970) Zonal Target. Reversal Selloff during the afternoon session retested the morning breakout with a final Market On Close $4.3 Billion Buy Imbalance. Prior range was 87 handles on 2.213M contracts exchanged.
…Transition from Cycle Day 1 to Cycle Day 2
This leads us into Cycle Day 2 (CD2): Normal for CD2 would be for some consolidation of previous volatile session. Given that the Three-Day Cycle Objective (3960) has been fulfilled, expectation will be for continued balancing activity. As such, scenarios to consider for today’s trading.
Bull Scenario: Price sustains a bid above 3940, initially targets 3965 – 3970 zone.
Bear Scenario: Price sustains an offer below 3940, initially targets 3925 – 3920 zone.
PVA High Edge = 3965 PVA Low Edge = 3925 Prior POC = 3951
*****The 3 Day Cycle has a 91% probability of fulfilling Positive Cycle Statistics covering 12 years of recorded tracking history.
For more detailed information for both bullish and bearish projected targets, please visit: PTG 3 Day Cycle and/or reference the Cycle Spreadsheet below:
Link to access full Cycle Spreadsheet > > Cycle Day 2 (CD2)
Thanks for reading,
PTGDavid
If you are interested in a Guest Pass to the PTG Trading Room, please email your request to david@polaristradinggroup.com
Economic Calendar
No responses yet