Hello members! As (hopefully all of) you know, we have switch newsletter providers! This will allow us to seamlessly add more features and create more value down the road. That said, there is a learning curve when you flip the “go-live switch” — even if we have been practicing on the new system! 🙂
So for that reason, we will continue to send from both providers this week, making sure we can work out the kinks and to make sure every premium sub is receiving the new newsletter.
Thanks for bearing with us through this transition. It will definitely be worth it!
The Sender Name should show up as: “The Opening Print — Mr. Top Step”
Our View
A few weeks ago, the market was “certain” that the Fed would raise rates by 50 basis points at the current meeting. That’s after Chairman Powell’s decisively hawkish testimony, where he laid the groundwork for a larger-than-expected rate hike and and higher rates for longer than expected.
Then the regional banking crisis happened.
Now the market expects a softer approach from the Fed, which includes a rate hike of just 25 basis points. That’s probably the smart move.
“No hike” could give the markets a sugar-high rally, but ultimately says to the market that the banking crisis is more severe than we think. A 50 bps hike creates worries about more stress on bank balance sheets.
25 basis points allows the Fed to save face without causing too much worry. It’s the press conference at 2:30 we have to look out for…
Our Lean
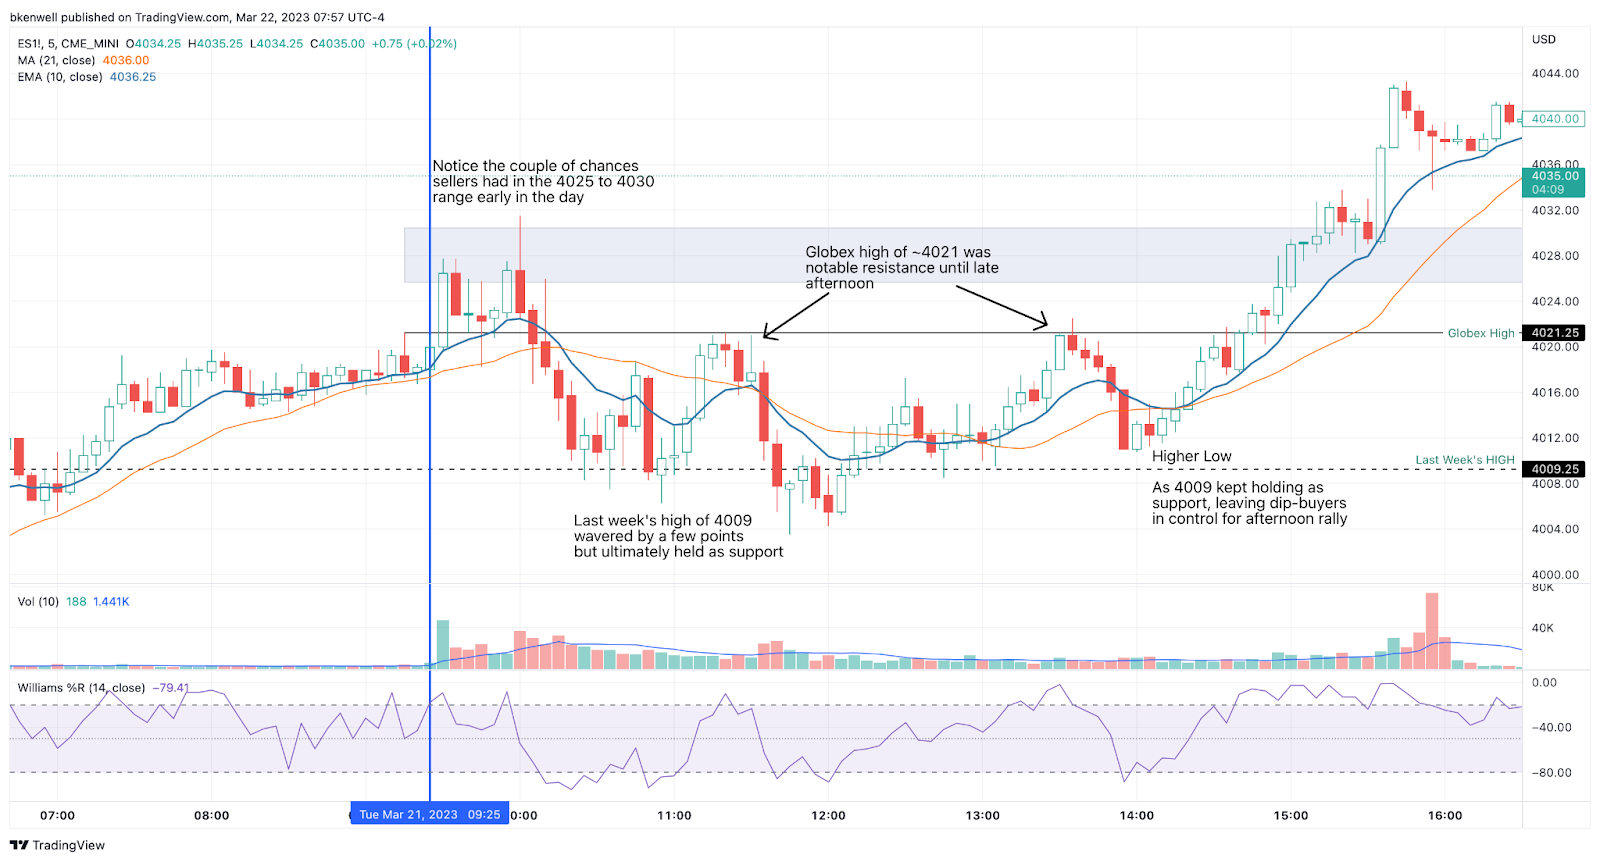
I don’t know that yesterday could have gone much better. Selling the opening rally into the 4020 to 4030 resistance area “(and preferably 4025-4030)” gave traders a couple of quick scalps of 10 to 20 points.
However, the second part of the Lean was to buy the pullbacks, particularly if the ES was “very constructive for the bull case” by staying over last week’s high of 4009. Just look at the chart below and try not to look at it “in the past” but instead, save it, download it — whatever — and try to apply some of the logic and levels to your trading going forward.
This is how we often look at price action throughout the day (Globex high/low, last week’s high/low, etc). Of course, it helps to have a plan going into it the day:
On to today.
Paraphrasing my friend Jeff Hirsch of the Stock Trader’s Almanac, he said that “the S&P 500 has been up 5 of the last 8 Fed rate hike announcement days, with an average gain of 0.69%. It’s been down 5 of the last 8 on day after, average S&P 500 loss of –0.91%.”
Our Lean:
The ES is “cautiously” holding up over the 4025 area during Globex, but there will likely be some fireworks later today. As you can see from the stats at Trader’s Almanac, today and tomorrow are likely to be bumpy. The only problem is, we don’t know which way this one is likely to go; no one does!
Many traders would like to see a higher open and/or a push higher into midday trading so they can exit their longs or take partial profits. I know we would like that on a few of our trades.
In any regard, I think the upside move is likely limited into the Fed event. It always seems to stall out as nobody wants too big of a position into a binary event. I am likely going to wait until 2:00 to put on any real trades.
Remember, the algos love to run the stops, which are often on/near the edge of the day’s range. Look for more of the same today!
MiM and Daily Recap
If you want the recap, just look at the graphic above. The ES faded from the 4030 area shortly after the open, held last week’s high near 4009 and bounced. It struggled to regain the Globex high of ~4021, but in the afternoon it put in a higher low near 4010, charged through 4030 resistance and traded up to 4040.75 at 3:50.
The cash imbalance showed $863 million to sell, grew to more than $2.4 billion for sale and the ES traded 4038.50 at 4:00. At 5:00, it settled at 4039, up 52.75 points or 1.32% on the day.
In the end, it was a “choppy grind higher” — just like the day before. In terms of the ES’s overall tone, it was bullish but sluggish. In terms of the ES’s overall trade, volume was very light at 1.44 million contracts, 31% below its 20-day average and its lowest volume since Feb. 13.
Technical Edge —
-
NYSE Breadth: 85% Upside Volume
-
Advance/Decline: 78% Advance
-
VIX: ~$21.50
S&P 500 — ES
-
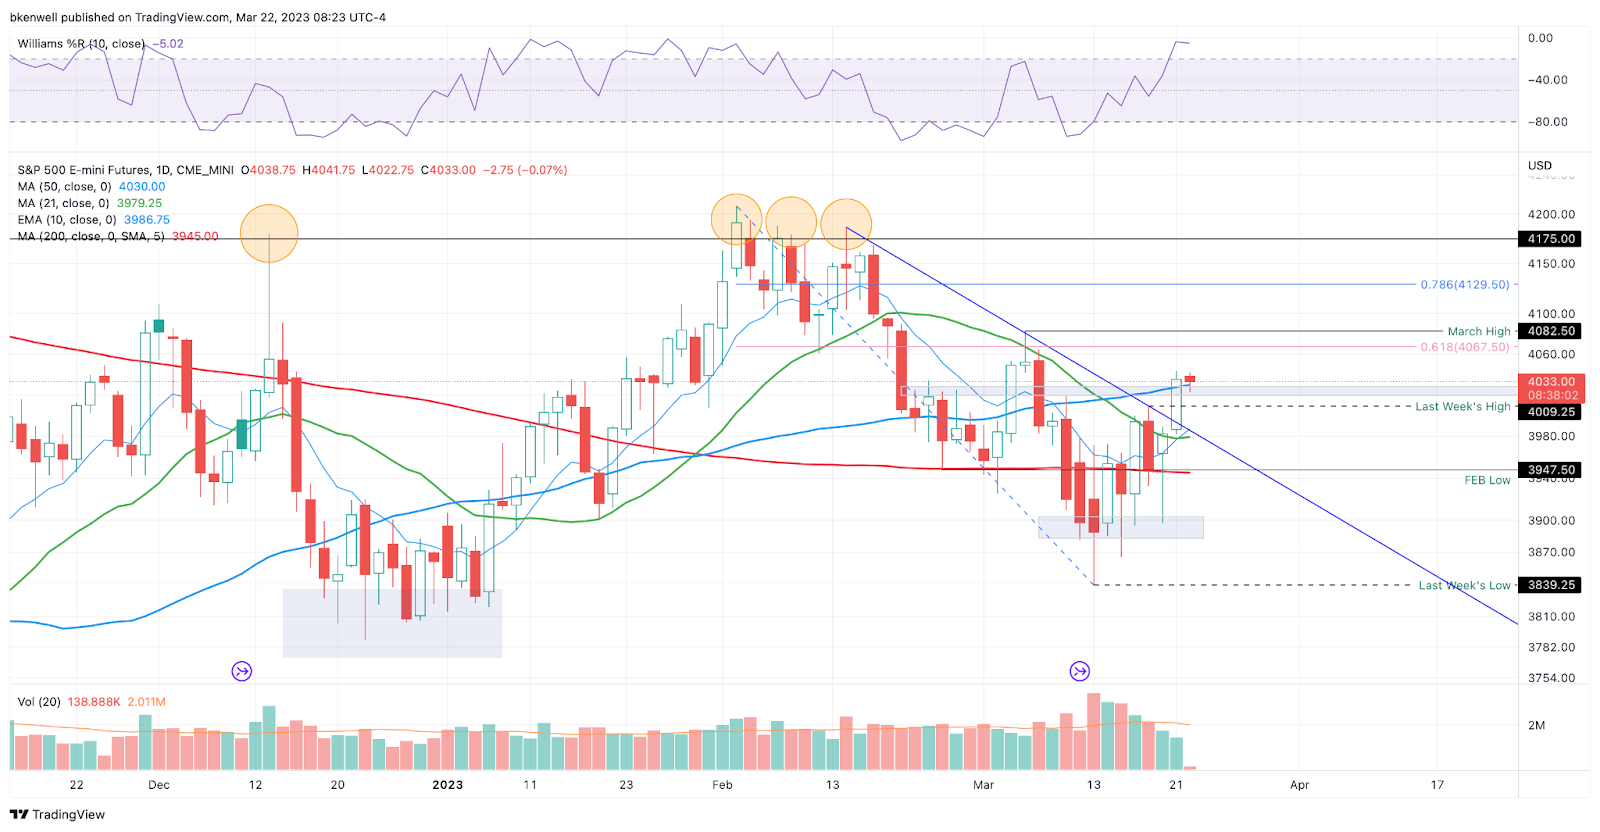
Downside levels: 4020, 4009 (last week’s high), 3975-80 & 3948-58.
-
Upside Levels: 4045-50, 4067.50, 4082, 4100, 4130.
SPY
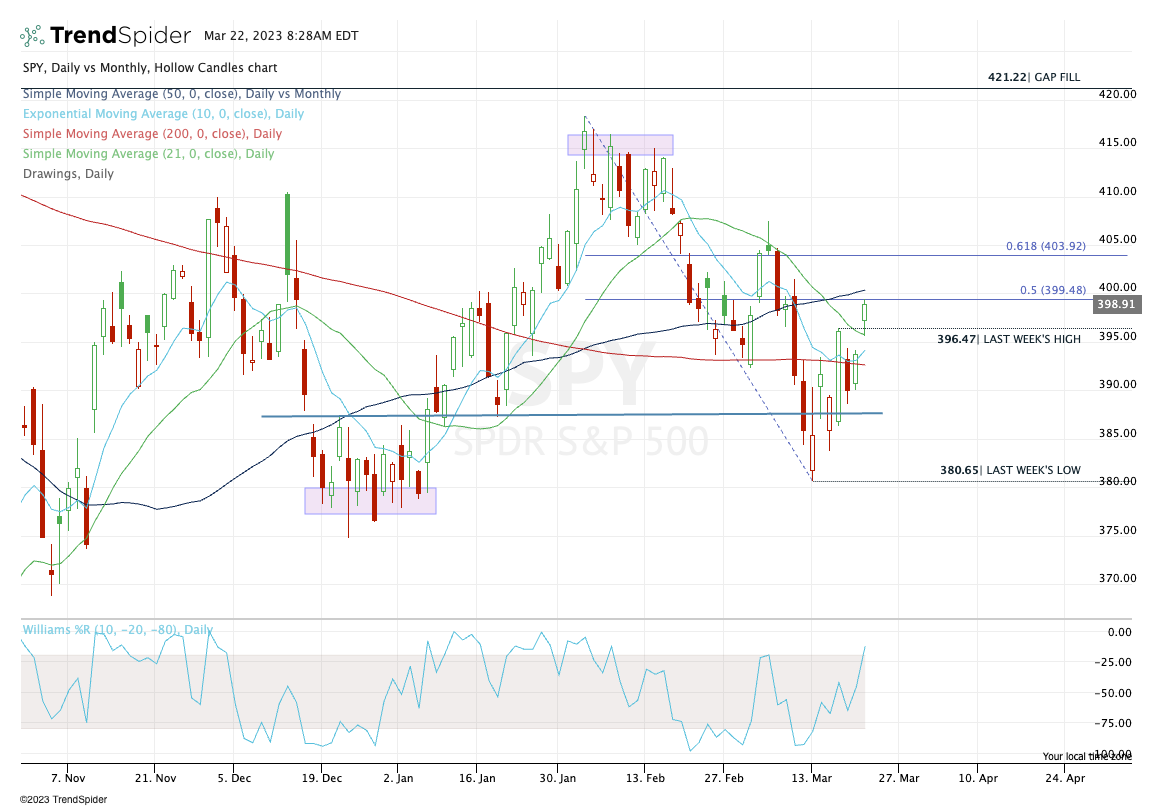
SPY retraced 50% of the decline and now the Fed’s on tap. On the upside, bulls want to see the SPY regain $400+. On the downwide, bears need to get the SPY back below last week’s high.
-
Upside Levels (SPY): $399.50 to $400.50 (call it $400), $404, $407.50
-
Downside Levels (SPY): $396 to $396.50, $394, $392.50, $390.
SPX
Same as SPY, with the following levels:
-
Upside Levels (SPY): 4000-4010, 4045-50, 4075-80
-
Downside Levels (SPY): 3964 (last week’s high), 3940-45, 3915-20
AMZN
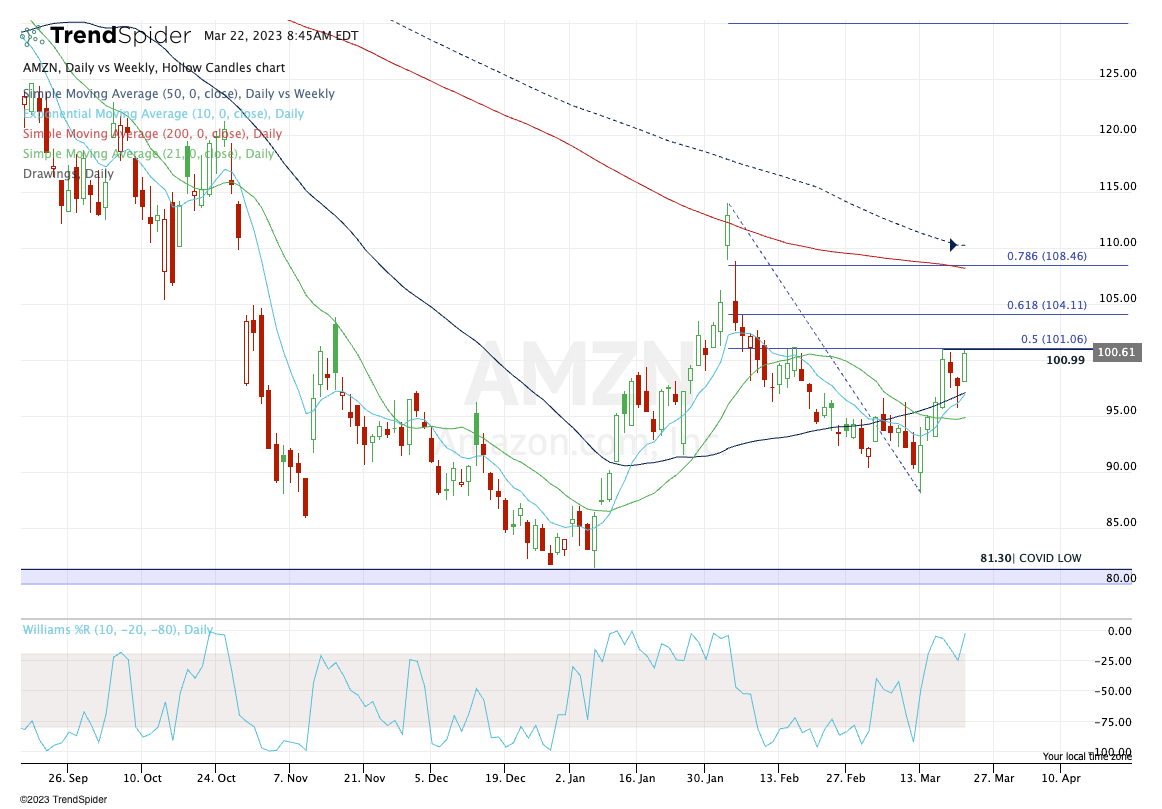
If only the Fed weren’t in play today, AMZN would be a prime setup. Look at that daily + weekly-up building near $101, along with the 50% retrace.
A rotation over this level opens the door to $104, then $108-$110.
On the downside, risk could be clearly defined down to ~$98 for conservative bulls and ~$95 for aggressive bulls who use a wider stop.
Unfortunately, the Fed makes this very tricky. I will likely wait until we hear from them before deciding on AMZN here. If it triggers early on, I might go with a ¼ position just to get it started and manage from there. Vague, I know. But Fed days are notoriously tricky and large position sizes wreak havoc on our mental capital.
Open Positions
-
Bold are the trades with recent updates.
-
Italics show means the trade is closed.
-
Any positions that get down to ¼ or less (AKA runners) are removed from the list below and left up to you to manage. My only suggestion would be B/E or better stops.)
-
** = previous trade setup we are stalking.
-
FSLR — Down to roughly ½ size here after trims near $206-07 and $210-11.
-
B/E stop and look to get off more between $213 to $215 if possible.
-
-
AAPL — There was a decent entry on the intraday charts, but regardless of how traders bought AAPL, it closed strong on the day.
-
Aggressive bulls can use a stop-loss of $153-$154. Conservative bulls may go just below yesterday’s low (roughly $156-ish).
-
As for upside, it all depends on timeframe. If shorter term, anything over yesterday’s high warrants a trim. If longer term, you’ll want $160+ and ideally something close to $164.
-
-
DKS — Long on the daily-up at $146.65 — Trim ¼ on any push over yesterday’s high and be down to ⅔ or ½ if we see $149-$150.
-
Stop at $143 — and keep the Fed in mind here. If nervous/concerned, trim down on size and/or be quick to take profits if opportunity arises.
-
Go-To Watchlist
*Feel free to build your own trades off these relative strength leaders*
Relative strength leaders →
-
NVDA, AMD, AVGO
-
CRM, GOOGL
-
MSFT — Nice setup on H4 chart
-
PANW, FTNT
-
FSLR
-
GE
-
DKS
-
AQUA
-
ULTA
-
AEHR → volatile!
-
MELI
Economic Calendar

No responses yet