Follow @MrTopStep and @BretKenwell on Twitter and please share if you find our work valuable.
Our View
I don’t want to talk about SVB or any of the other banks — you can get that from CNBC. Instead, I want to talk about where I think the S&Ps are going and how long this mess is going to last.
I don’t have a crystal ball, but I do have my longer term charts that continue to say any big rips will fail. I know some people will say I’m nuts, but so far I have been right about the direction.
Previously, I have expected 2023 to be a big range play. In other words, no new all-time highs and perhaps not taking out the recent low. Now I am leaning toward new lows at some point. If things become really dire, we could see the ES down to 3,000 and the Dow (YM) down to 28,500.
Sometimes, I think people forget the ES bottomed near 2175 at the Covid low and rallied more than 2,600 handles.
I am 100% sure that most of the bulls think the Biden administration and all of its spending will ‘hold’ the markets up, but I think what we have been seeing over the last few days is just the tip of the iceberg.
I’m going to leave it at that, but I would appreciate any feedback from you by writing a post in the comments section or emailing me personally at danny@mrtopstep.com. I also want to thank all of you for being part of the MrTopStep Opening Print.
Our Lean
In bear markets, there are always dead-cat bounces and short squeezes. The trick to this is that you catch a rip and not to fall in love with it.
Our Lean: The CPI is going to rule the morning action. Buy a gap down open and sell any 40 to 60 point rips. If the ES comes in higher I would be looking to sell the gap up and buy the pullbacks. As they say, patience is a virtue. Go slow, pick your spots better and use stops.
Two stocks I like the most: MSFT and AAPL.
They have the financials to withstand the issues on Wall Street.
MiM and Daily Recap
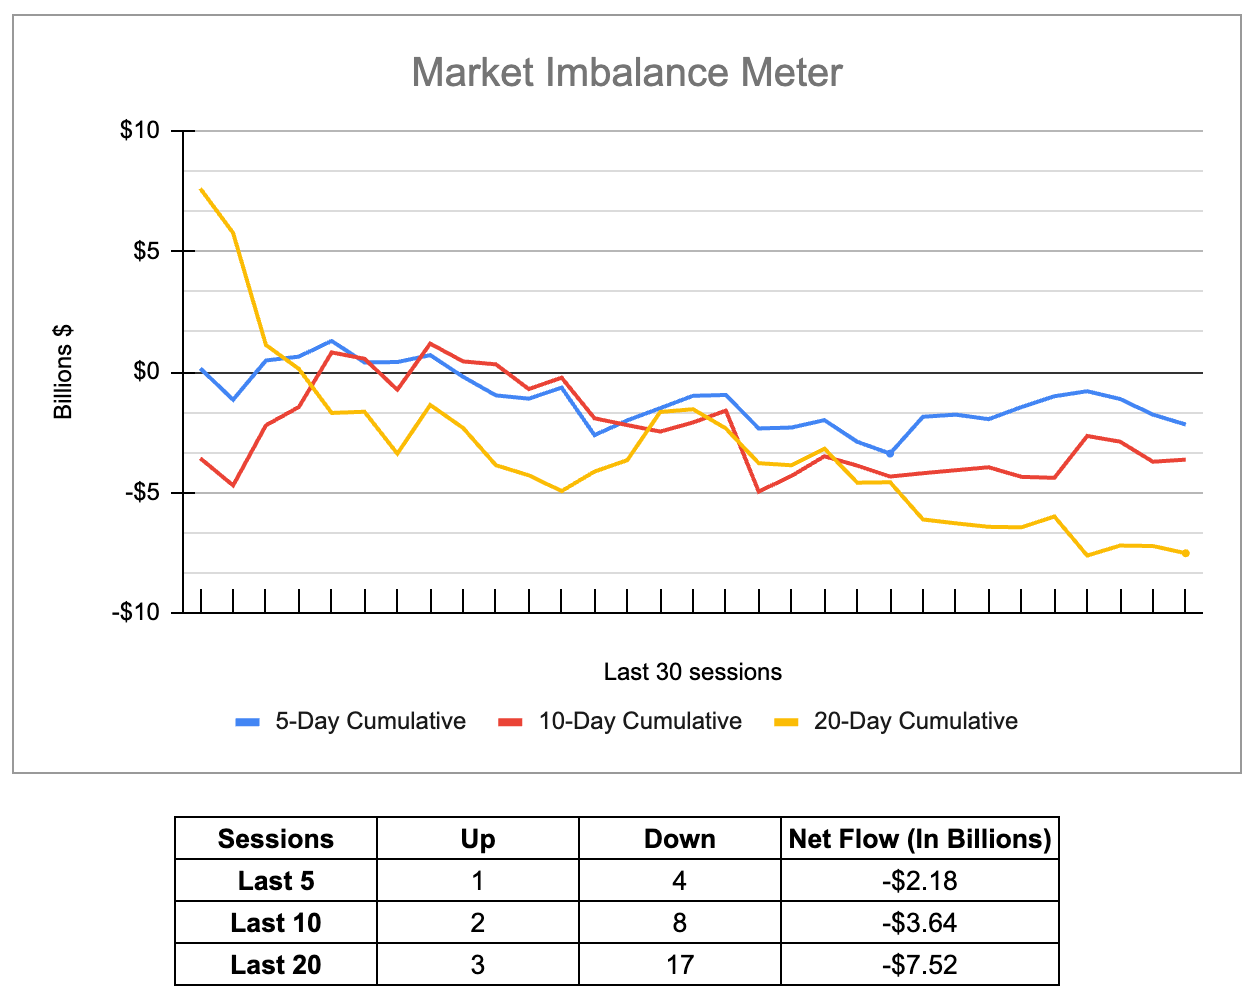
The ES traded up to 3971.50 on Globex and opened Monday’s regular session at 3852.25, — and yes you are reading that right! I’m not going to do all the twists and turns today. After the open, the ES rallied 60 handles up to 3908 and then sold off down to 3940.75, just above the Globex low at 3839.25 and then rallied all the way up to 3934.25 at 11:30.
The ES pulled back to the 3910 area and then rallied up to a new high at 3940.50 shortly after 12, dropped down to 3929 and then rallied up to ~3932 at 2:30 — a lower high — and then traded down to 3911 at 3:06. The ES then puked down to 3891.50 at 3:30 before rallying up to 3911 at 3:43 as the early imbalance showed $157 million to sell and sold off down to 3898 at 3:48. The ES traded 3900 as the 3:50 cash imbalance showed $2.6 billion to sell, traded down to 3888 and traded 3898 on the 4:00 cash close. After 4:00, the ES rallied up to 3897.50 and settled at 3995, up 14 points or +0.42% on the futures close.
In the end, the PPT came to the rescue. In terms of the ES’s overall tone, it was firm but whippy. In terms of the ES’s overall trade, volume was high at 3.4 million contracts traded (as the contracts roll).
Technical Edge —
-
NYSE Breadth: 27% Upside Volume
-
Advance/Decline: 26% Advance
-
VIX: ~$26
The tough part about right now? The market is trying to re-price everything vs. where we were just a few days ago. Bond yields have gyrated considerably, with the 10-year yield down 15% in three days, the VIX jumped 50%, and we’ve gone from a strong likelihood for a 50 basis point interest rate hike next week to a 25% chance we’ll see no rate hike at all.
Taken all together and the S&P has actually held up okay. Still, it’s a lot of weight to bear and being tactical is likely our best approach for the time being. Remember, the index is below all of its major daily moving average and the VIX rip is not exactly begging us to get on margin and take a shot somewhere.
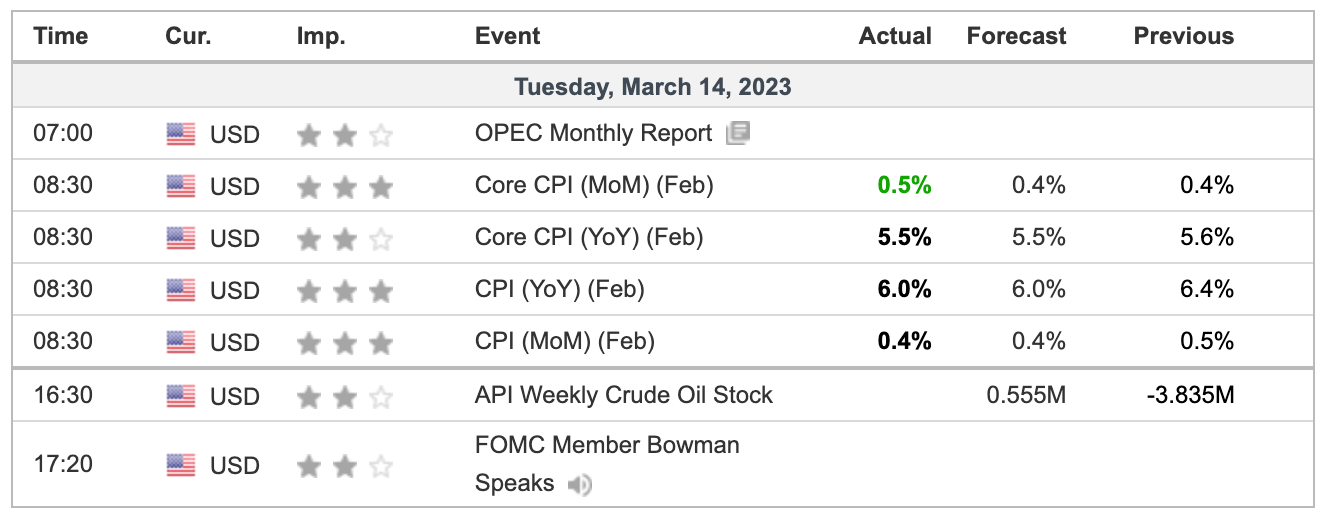
Mostly in-line CPI results have the market a bit mixed in terms of what it wants to do, so let’s look at our levels and see how the S&P does after the open.
S&P 500 — ES
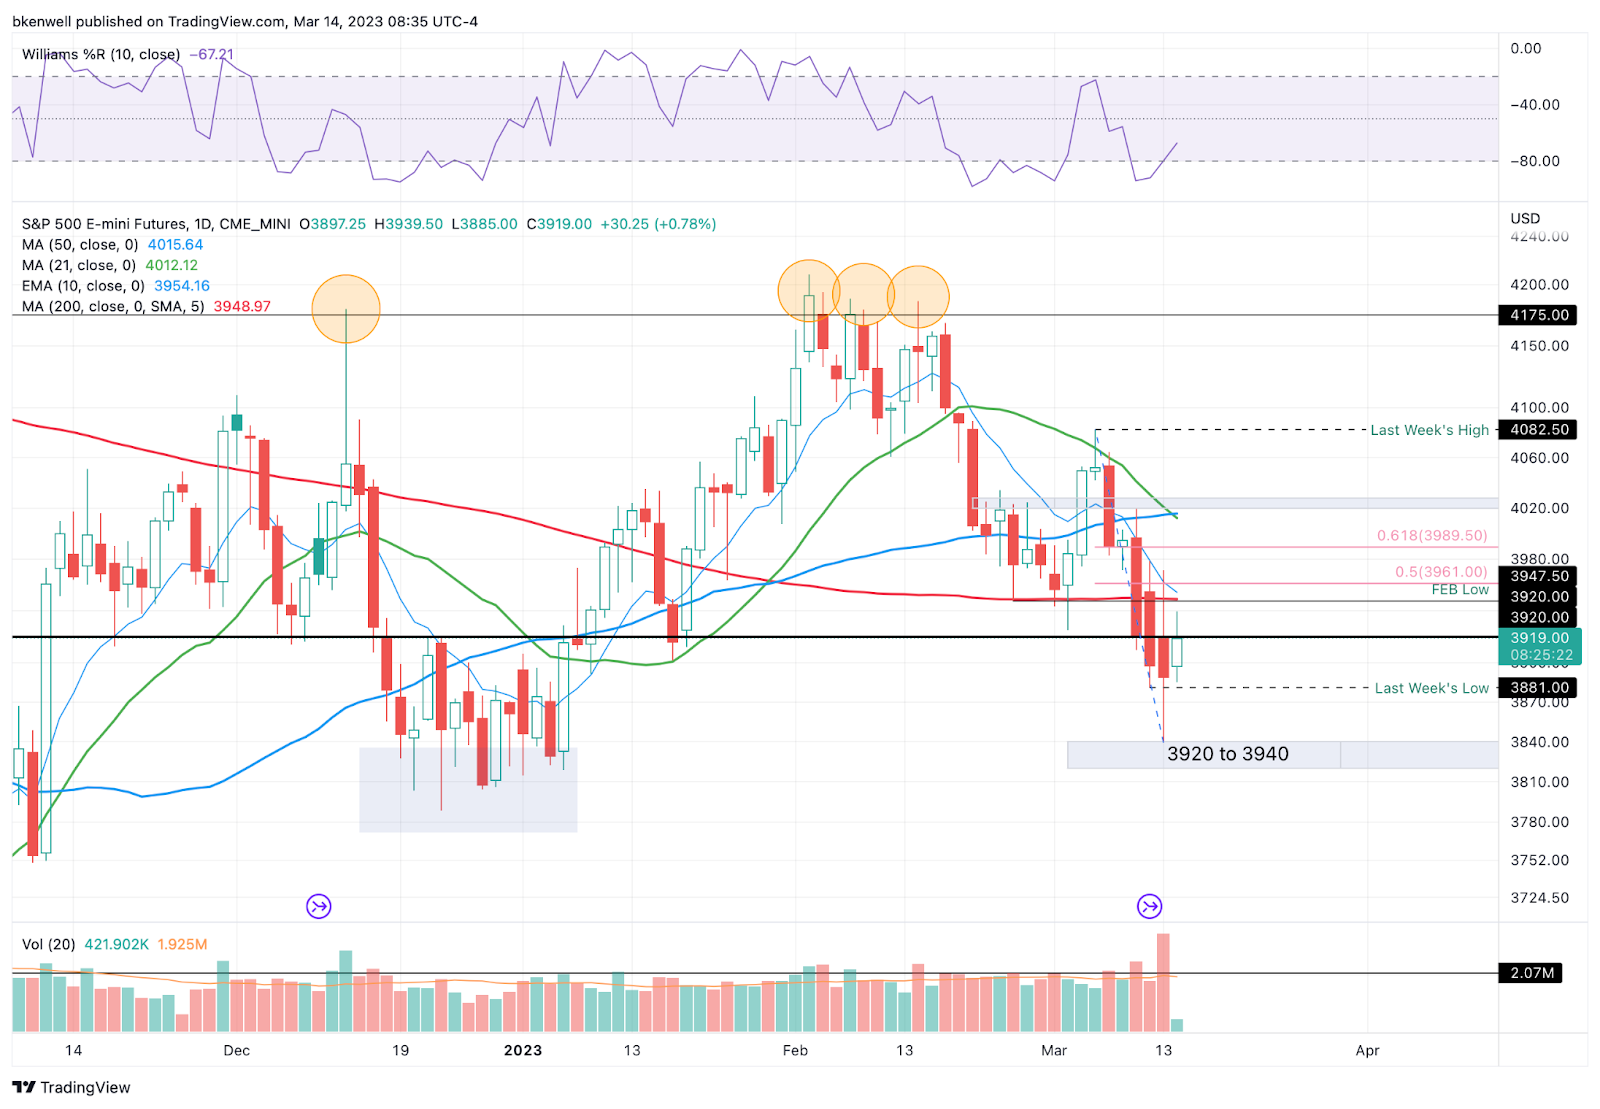
Yesterday’s low went down to and barely tagged out 3820 to 3840 support zone, bottoming at 3839.25 and bouncing higher. So far, the ES doesn’t know what to make of the mostly in-line CPI report.
However, I do know this: 3920 remains relevant, while 3947 to 3960 is a monster level.
In that zone we have the 50% retracement from this week’s low to last week’s high, the 200-day and 10-day moving averages and the February low. I would be a seller in that zone. If we’re wrong, we’ll know quickly enough.
On the downside, 3880 to 3890 is carving out a decent support zone. That’s last week’s low, Monday’s close and today’s Globex low.
Below 3880 and failure to regain it puts yesterday’s low back in play.
SPY
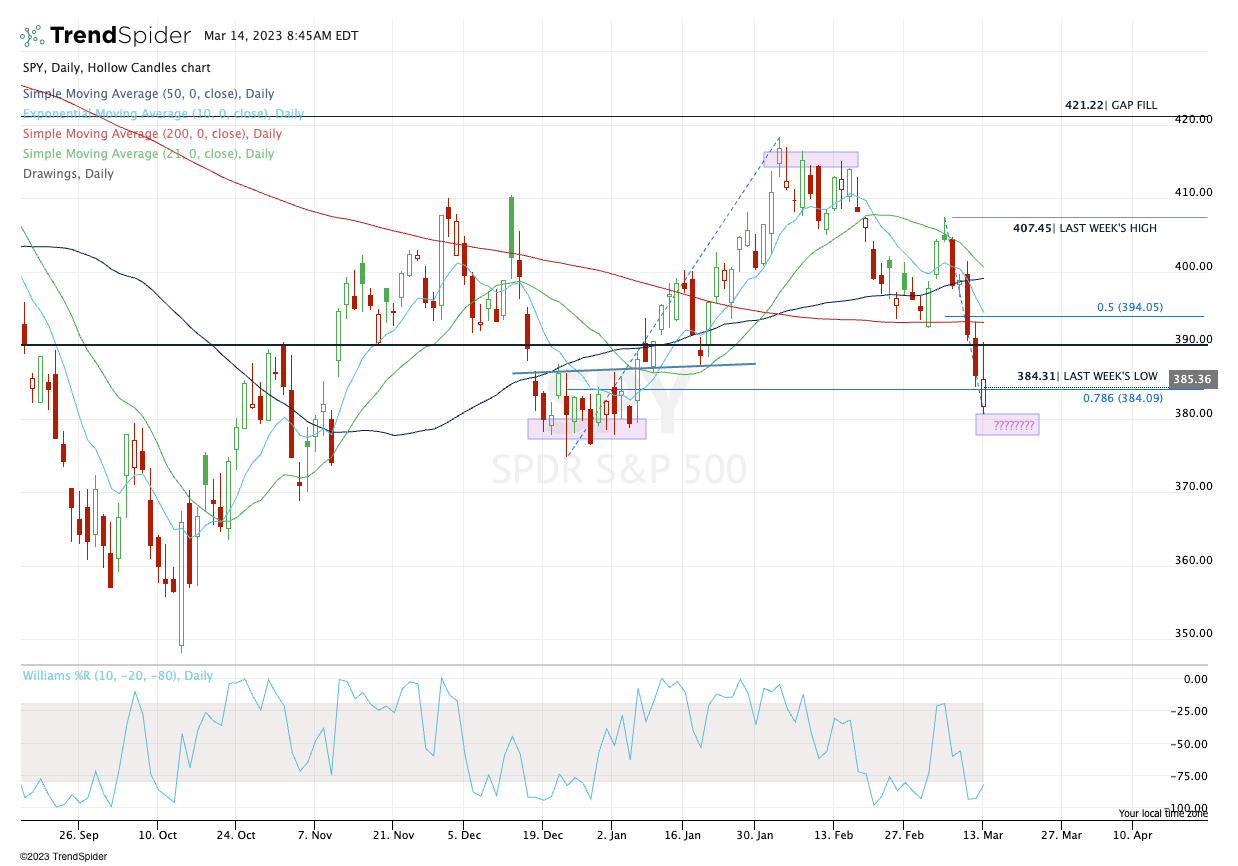
Support held where it needed to yesterday, but from here it’s less clear on where we go.
On the upside, my key levels are ~$390 (yesterday high and notable pivot) followed by $394. The latter marks the 50% retracement, the Feb low and the 10-day and 200-day moving averages.
If we see $394, it’s a decent spot for a short. If we’re wrong, we’ll know quickly.
GE
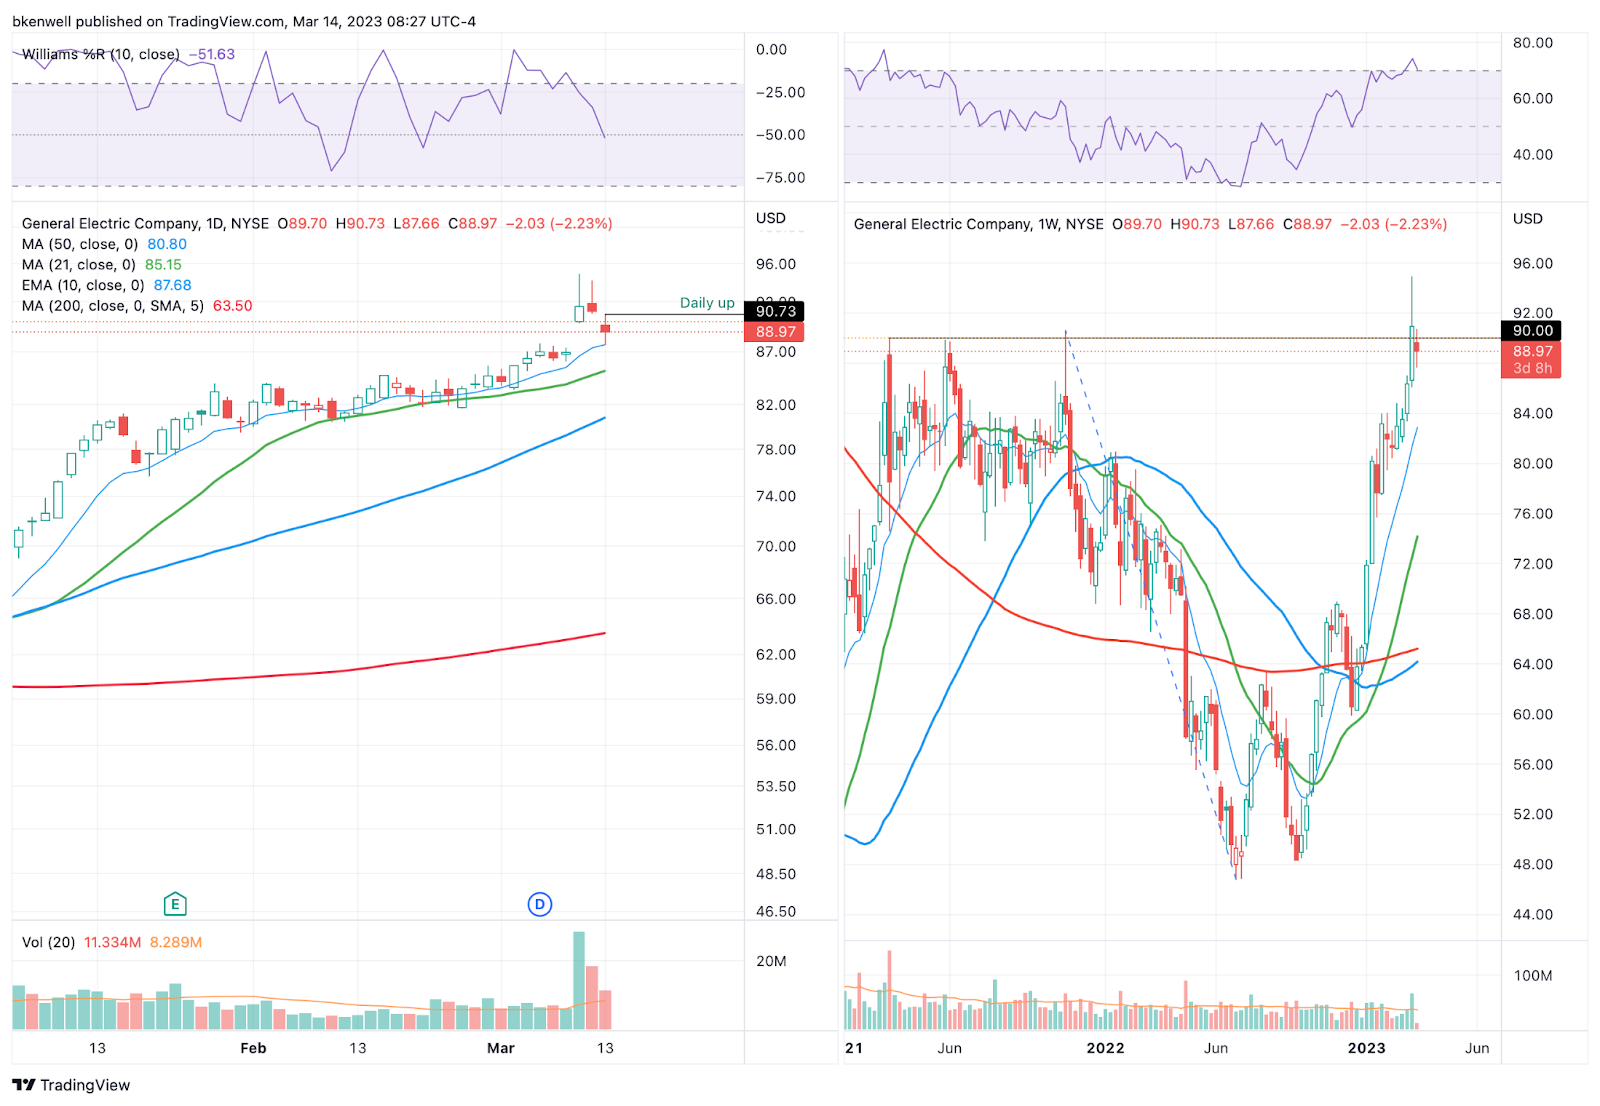
Last week, GE stock tried breaking out over stiff resistance at $40. (Tough time for breakout trades, am I right?)
If we go daily-up over $90.73 today, bulls can be long against $87.50 and look to trim at $92, $93.25 to $93.50 and $94.50+
FSLR

Nice setup on FSLR. I didn’t want to take it during yesterday’s messy action, but it’s one I’ll be watching today. An inside day here would be a great potential setup for tomorrow.
Keep an eye on this one.
Open Positions
-
Bold are the trades with recent updates.
-
Italics show means the trade is closed.
-
Any positions that get down to ¼ or less (AKA runners) are removed from the list below and left up to you to manage. My only suggestion would be B/E or better stops.)
-
** = previous trade setup we are stalking.
-
MRK — Long from ~$110 and (disappointing action as it was oh-so-close to our first target, missing by a few dimes) — Ideal stop is clearly defined near $105. Initial target for ⅓ trim is $112.50.
-
Natural Gas, UNG or /NG — First target hit at UNG ~$10 and NG at 2.95 to 3.00.
-
Now /NG needs to hold the $2.40 to $2.50 mark in order for bulls to stick with this one.
-
Trim NG at $2.80 to $2.90. UNG at $9.25
-
-
AMD — Long on weekly-up over $81.63 — We got a third trim in AMD at $86 but not quite another trim at $88. That’s okay. B/E stop or full exit is fine.
Go-To Watchlist
*Feel free to build your own trades off these relative strength leaders*
Relative strength leaders →
-
FSLR
-
NVDA, CRM
-
PANW, FTNT
-
AVGO
-
GE
-
AQUA
-
TSLA
-
WYNN, LVS → would love a reset to the 10-week ema
-
SBUX, ULTA
-
AEHR → volatile!
-
MELI
-
BA
Economic Calendar
No responses yet