
Market Review

That’s not just the end of the wall, it could be the end of our country.
There is some talk, they may start back construction next week… The FED said they did not see inflation yet, just a small transitory. A brief duration. Temporary, the transitory nature of earthly joy. Tending to pass away, not persistent. Like life after 2019…
In the Pros and Numbahs, I’ve been talking bout how the prices of commodities are soaring at record highs. Last night, on the Denver Channel news, they had a five-minute clip of how new home builders/buyers are being priced out of the market.
The emperor has no clothes, but you can’t talk about it, And that’s all I have to say about that!
Let’s talk about the market. How a 1930s trader may have seen and traded yesterday’s; “Throw Momma from the Train event”. That’s how WB would have said it. But how would a Barcalounger boy from the 1930s see it?
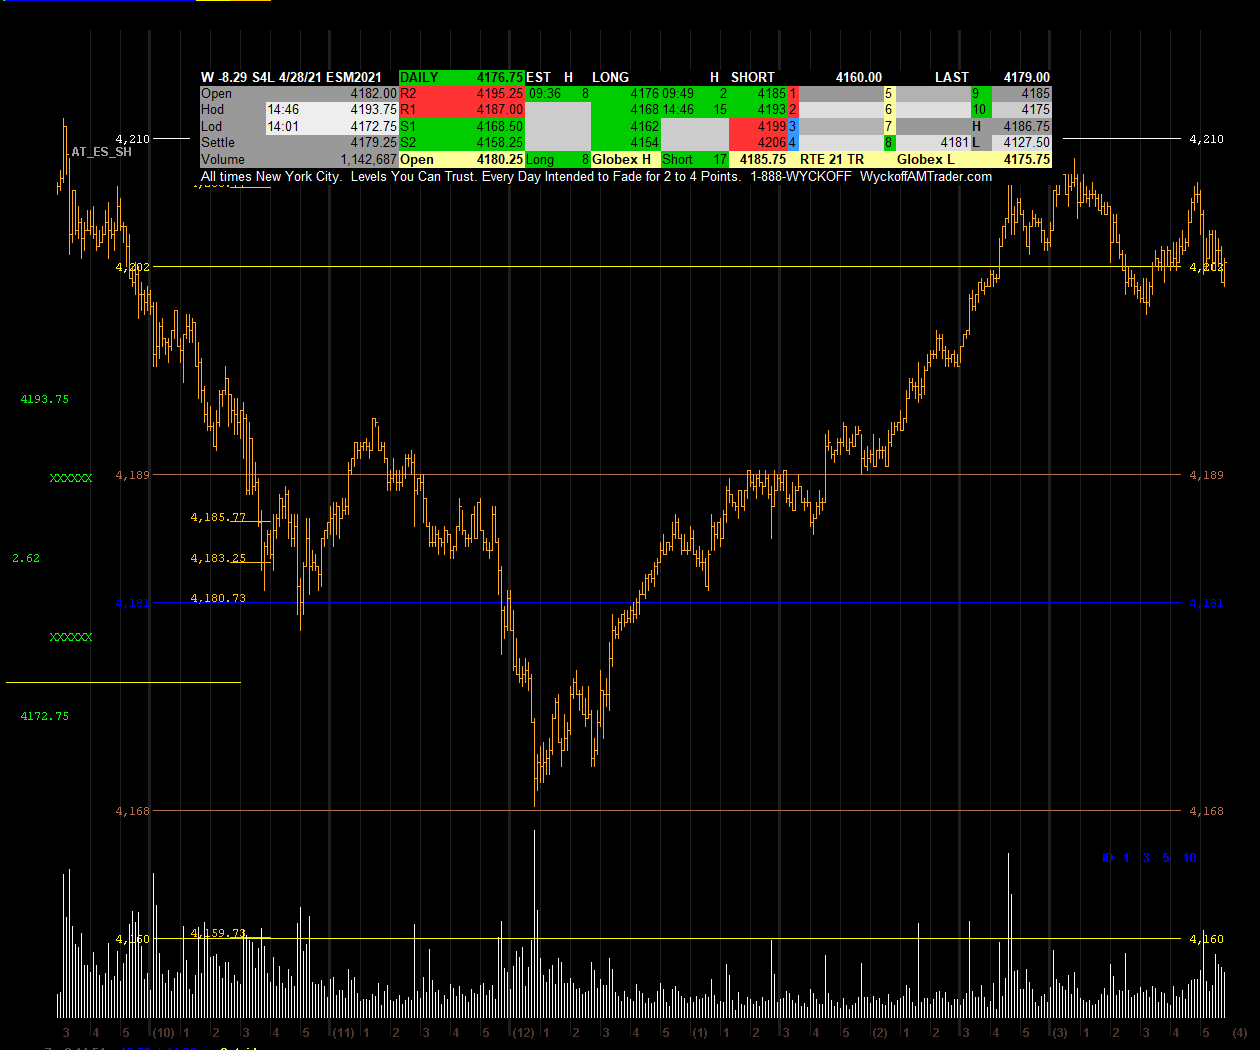
Globex had gotten price over their skis at the 4207 handle around 4:00 am. Cash had to decide if would they accept that as value or offer price down to get to wholesale, to load up the wagon. End of story. Here’s how that played out!
Price opens at 4210 and quickly a selling wave enters for 15 minutes taking price down 8 points. A half-way correction is up to 4106. A total of 57,000 lots trades on the way down. A rally back lasted just five minutes recovering just half of the reaction. If you were to get short this would have been the time and place.
Across the 4204 a total of 43,000 appeared as late buying showed its inability to absorb offerings led to the development of weakness for the next thirty minutes. At the 4190 a 5-minute rally developed, recovering just one point more than the previous rally.
The trader has the option to add on more as the rally begins to fade and the selling pressure takes over.
Next, a 10-minute reaction finds a bid at the 4181 handle. A 10-minute rally lasts 5 minutes longer and recovers 5 points of a 14 point decline. The next reaction lasts 5 minutes but falls short of the previous 14 point decline. Erasing just 7 points and extending the low of day by just 2 points more.
This warns the active trader that potential preliminary support may be drawing nigh.
The next rally lasts 25 minutes regaining 13 points. The time is 11:15 and there are 45 minutes left till the 12:00 lunchtime slog. If a trader were reading the tape they would have been impressed with an increase of volume as each trade ticked by.
Next a 20-minute 8-point reaction to the half-way 4184. This exceeds the previous 5 minutes 7-point reaction in time and distance. A weak tepid 25-minute, 2-point rally the weakest of all; starts to round over. Across the 4185 the trader sees a total of 81,000 lots and 43,000 at 4184. These offerings totaling 124,000 prove too great to absorb as price starts to lose the 4183.
On the tape the trader sees the intensity of action increasing as price prints a low 16,000 at 4177 gives way to a new low off day. The trader can see two waves (mentioned above) of potential re-distribution totaling 20 points indicating a move down to 4165.
It’s 12:00 and the lunch time SLOG begins. Price slides over past 8 minutes as the new low of day is printed 4168. Failing just three points from the projected 4165 from the point and figure count.
This new low of day on greatly increased volume confirms the preliminary support and indicates this may be the low of day. A 15-minute move up and then a 5 minutes down confirms the selling climax as the Automatic rally and secondary test is exceeded as price moves out for a “V” shaped recovery.
This indicates that the market is sold out and gives a strong technical position as shares once again leave the weak hands and enter the strong. The objective is where else? Back to where momma got thrown from the train.
The younger boys call it a liquidity vacuum. The old school Barcalounger traders and Wyckoff himself called it a sold-out condition. Either way, the market is going back up from whence it came!
I put out a daily The AM Trade email where we look at the market as if it were through the eyes of the old school 1930s traders. For now, it’s FREE, You’re under no cost or obligation and you can unsubscribe at any time. So click the link below to see how the Barcalounger Traders may have seen the market today!
http://wyckoffamtrader.com/chart
Looking Forward Friday, April 30, 2021
Big tech was supposed to save the day. And unemployment benefits dropped. Covid cases are dropping and you can drop the mask whilst outside. What else needs to drop?
Price of commodities. Price of food. Price of progress. To build back better than before. That sounds like the pitch for the 6 Million Dollar man to me, but it’s 2021, so let’s make that trillion dollars the 6 trillion dollar man!
It gets approved, the market is going up. Damn the torpedoes and your great and great-great-grandchildren, too. By then, the U.S. dollar will have lost it’s PEG and a new form of currency will be in circulation…
As I write this Globex is trading 4192 and has retraced about half of yesterday’s CASH range finding a low at 4186. That’s just where we had the previous base from RTE CASH trading. It’s not what GLOBEX does, it’s what the boys getting off their helipads in Manhattan around 7:00, 8:00 and 9:00 o’clock do.
I consider myself fortunate to be able to keep WB’s Memory and Trading Legacy alive today. For traders now and in the future who will benefit from his savvy wisdom and trading techniques. I really do feel that the clock can separate you from where you are now to where you want to be.
But, it’s NOT EASY TO LEARN!!!
Most folks/traders who subscribe and never contact me fall by the waist side. And some who I’m still friends with still can’t’ get it! It’s not easy. But it’s worth the effort.
If you are reading this and are not a subscriber, now would be a great time for you to subscribe.
Click the red button below to SUBSCRIBE to the AM TURN NEWSLETTER

After you subscribe drop me an email at trader@wyckoffamtrader.com we’ll set up a time to talk and help you discover how using WB’s clock can give you the gift of timing that you need in your trading life.
Economic Calendar


Closing Prices

In the TradeChat Room
Market On Close – MiM

Check out all the Market Closing action in our daily post
Questions? Please email me: Marlin@mrtopstep.com
Get the skinny when we get it: Join the MiM.
.
SpyGate: Chasing the Bots – How the Bots trade a V day


Check out our Daily SpyGate Post
SpyGate is now available free to members of IMPRO and MIM trading room. Join the MiM.
Chart of the Day
Dave Wilson’s Chart of the Day
Crop-Price Surge Approaches Fastest U.S. Pace in Decades

Mondelez International Inc. plans to “price away inflation,” according to comments made after reporting first-quarter results on Tuesday. Judging by the pace of crop-price increases, other foodmakers may have to follow suit. The Bloomberg Agriculture Spot Index’s annual rate of change surpassed 75% this week for the first time since June 2011. In the process, the index came within striking distance of the biggest year-to-year advance in its 30-year history: 82.5%, recorded in March 2008. Strategists at Deutsche Bank AG highlighted the current surge in a note Wednesday.
Our View
S&P 500 futures Recap – Trade Date April 29, 2021

Amazon’s Record Earnings; Was It Ever In Doubt?
The S&P (ESM21:CME) gave President Biden’s first speech before a joint session of Congress a ‘big thumbs up’ with new all-time contract highs at 4211.00 just after Thursday morning’s 9:30 ET open. After the high, the Nasdaq 100 futures (NQM21:CME) started to reverse, pulling the S&P down. At 10:51 the ES made a low 4181.00, 30 points off the high, rallied up to the 4192 area then another wave of tech selling hit pushing the ES all the way down to 4168 at 12:10. After the low, the (NQM21:CME) started to short cover pushing the S&P up into the buy stops up to the 4186 area. After a small dip, the ES started doing some back and fill just below the vwap and at 2:46 the ES traded all the way up to 4209, 2 points shy of the contract high. It’s all about money flows and yesterday’s rotation was buying the S&P and selling the Russell 2000. After 3:00 the MIM showed $300 million to sell and traded 4190.75 as the 3;50 cash imbalance showed $900 million for sale. On the 4:00 cash close, the ES traded 4102.00 and settled at 4200.00 on the 4:15 futures close, up 15.25 pts or 0.38% on the day.
In terms of the ES’s overall tone the ES recovered but the weakness in the Nasdaq over shadowed the S&P. In terms of the day’s overall trade, it was a busy day with 1.75 million futures traded.
After The Close
Amazon (AMZN) reported crushing first-quarter sales of $108 billion, up 44% from the same period last year. AMZN blew away analyst predictions as income from January to March more than tripled to $8.1 billion, and revenue of $108 billion. The company’s profits in the year since the start of the pandemic exceeded $26 billion, more than the previous three years combined. I do not know how the ‘analysts’ come up with their predictions but very few saw the record profits coming from FAANG & friends. I was very clear about my call for gangbuster tech earrings and that’s exactly what we have been seeing and you know something? This is just the first quarter! Clearly, first-quarter growth has accelerated, consumer spending helped push total output almost back to pre-pandemic levels. According to the Biden Administration, gross domestic product expanded at a 6.4% annualized rate and personal consumption, the centerpiece of the US economy, surged by an annualized 10.7%, the second-fastest pace since the 1960s.
Our view, they say politics and trading do not mix but in the first 100 days of the Biden administration, the S&P has gained 11%. According to a Dow Jones Market Data analysis the S&P recorded its best performance since the start of President Roosevelt’s first term in 1933, when it surged 80% after a spectacular crash in the Great Depression. In the first 100 days of the Trump administration, the S&P rose 5.3%. Today is the week 4 Friday options expiration. In most cases I would be all over it for a ‘Later Friday RIP’ but I have a funny feeling about today. Our lean, sell the early rallies and buy the pullbacks. If the ES does pull back and bounce I want to see it at or near the highs at 2:30 ET. My range is 3165 to 3230.
Lastly, the MrTopStep chat really is the best it has ever been. Constant posts, levels, charts, news, trading flow. The traders in the chat, as I said, trade a lot of options. I think if you asked them they would say we do a good job. We all know not every trade works and I will be the first to say it. This is not a beginner’s room but we have helped hundreds of traders understand what we see. All I can say is when Traderdave and I agree that a rip is coming, the odds favor it. Have a great weekend and the link below will get you in the chat. Like it says; if you decide it’s not for you, we give you all your money back. Hope to see you today!
As we all know, there’s no crystal ball when it comes to trading stocks, options or futures. But the Market Imbalance Meter may be as close as it comes. Knowing how the “Big Money” is placing its bets can give our trading room a big wave to ride — or a warning sign to stay out of the water. Come check it out now, risk free for 30 days.
Danny Riley is a 39-year veteran of the CME trading floor. He ran one of the largest S&P desks on the floor of the CME Group since 1985.
As always, please use protective buy and sell stops when trading futures and options.
Disclaimer: Trading Futures, Options on Futures, and retail off-exchange foreign currency transactions involves substantial risk of loss and is not suitable for all investors. You should carefully consider whether trading is suitable for you in light of your circumstances, knowledge, and financial resources. Decisions to purchase or sell as a result of the opinions expressed in the forum will be the full responsibility of the person(s) authorizing such transaction(s). BE ADVISED TO ALWAYS USE PROTECTIVE STOP LOSSES AND ALLOW FOR SLIPPAGE TO MANAGE YOUR TRADE(S) AS AN INVESTOR COULD LOSE ALL OR MORE THAN THEIR INITIAL INVESTMENT. PAST PERFORMANCE IS NOT INDICATIVE OF FUTURE RESULTS
No responses yet