‘Thin to Win’ Is Today’s Theme
The Fed’s foot is off the gas?
Follow @MrTopStep and @BretKenwell on Twitter and please share if you find our work valuable.
Our View
If you look at a wider timeframe chart of the S&P, it’s clear that the ES is going to run into some big resistance above the 4230 level. This doesn’t mean that there won’t be another push on the upside, but I think it’s critical this week to remember the Pitbull’s trading rule that says: “The S&P tends to rally early in the week and early in the day during a bear market.”
As for the Fed, we had too many speakers last week and they left us with mixed messages. However, Chair Powell laid a more direct tone with investors. As reported by Fortune:
“Having come this far, we can afford to look at the data and the evolving outlook and make careful assessments,” Powell said, referring to the Fed’s 10 straight rate hikes, which have elevated its key short-term rate from near zero a year ago to about 5.1%, its highest level in 16 years.
That said, I think the Fed will remain data dependent. I don’t see anything getting any cheaper at the grocery store or at the gas pump, but it looks like they will let the rate hikes work through the system.
Does it mean the ES is going to come crashing back down? No, but I think there is a pull back / selloff coming.
Our Lean
In most cases, Mondays start out the new week on the slow side as the lowest volume day of the week so we can’t rule out some “thin to win” early in the week. As the week drags on though, I think there could be some let downs. I know there could be another pop when the US budget deal is passed, but the S&P has already rallied.
Our Lean: I’m sticking with “thin to win” today, but I don’t think the ES will have a very wide range today.
As for levels, I’m keeping a close eye on 4220 and 4240 to 4250 on the upside. On the downside, watch 4185 to 4190, 4170 and 4150 (plus or minus a few points).
MiM and Daily Recap
The ES made a Globex high at 4227.75 and opened Friday’s regular session at 4219.75. After the open, the ES made an early high at 4125.75 and sold off down to 4191.50 at 11:39 and traded back up to 4110 11:57. After the uptick, the ES sold off down to a 4193.25 ‘double bottom’ at 12:35, rallied back up to 4209 at 1:09 and sold black off down to 4193 at 2:18.
From there, it traded back up to 4205.75 at 3:05 as the early imbalance showed $755 million to sell. The ES traded 4205.50 as the final 3:50 cash imbalance showed $2.25 billion to sell, traded up to 4208.50 and then traded 4205 on the 4:00 cash close. After 4:00, the ES down-ticked a bit and settled at 4198.25 on the 5:00 futures close, down 13.75 points or -0.33% on the day. The NQ settled at 13,841, down 53 points or -0.38%, the YM closed down 163 points or -0.48% and the RTY settled at 1,775.80, down 15.3 points or -0.85% on the day.
In the end, Friday’s gap up open led to an all-day down-tick until the late day gamma squeeze going into the close. In terms of the ES’s overall tone, it traded on the weak side. In terms of ES’s overall trade, volume was steady all day at 1.6 million contracts traded.

MIM has definitely turned south lately.
Technical Edge
-
NYSE Breadth: 38% Upside Volume
-
Advance/Decline: 40% Advance
-
VIX: ~$17
There are not a lot of setups jumping out to me at this moment, so we’ll continue to massage the stocks we’ve got left and focus on the indices now that Opex is out of the way.
Some oddities across the board. 10-year yields are at 10-year highs, AAPL, NVDA, AMD, META and the SMH ETF are down 1%, yet the S&P and Nasdaq are flat. That’s as of 8 a.m. or so, but interesting that the market is ignoring that weakness for now.
S&P 500 — ES
We always look at the daily, so I wanted to zoom out here and look at the bigger picture (although upside/downside levels are still below).
The S&P gave us the 5-wave decline down to the 200-week moving average, but now it continues to put in higher lows while grinding against the 4220 to 4240 zone. It has been failing in this area since September.
A weekly close above this area could set the stage for a run to 4400. That said, we could still see sub-4000 (and even the 3800s) without the pattern breaking.
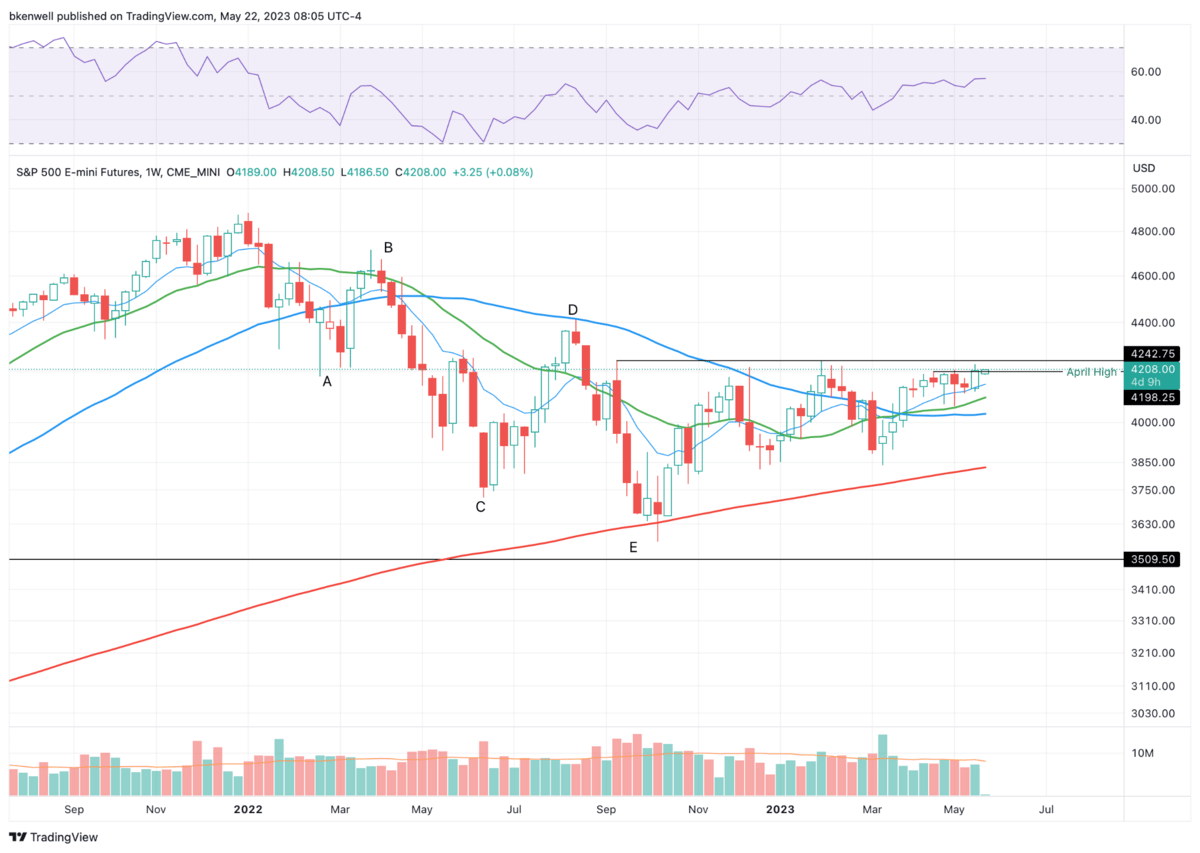
ES Weekly
-
Pivot: 4200
-
Upside Levels: 4220, 4242-45
-
Downside levels: 4186-4190, ~4170, 4150-55
SPY
There’s so much talk about the debt ceiling and “sell in May,” etc. I think we just go day by day and week by week. The SPY gyrated around the Q1 high on Friday. Let’s see if that is an active pivot today.
The $414 to $416 area was stuff resistance for a month. Below Friday’s low of $417.35 and failure to regain it could put that zone back in play. See that it holds this area as support if we dip that far.

SPY Daily
-
Pivot: $418
-
Upside Levels: $421.22 (gap fill), $425-26
-
Downside Levels: $414 to $416
SPX
-
Pivot: ~4187
-
Upside Levels: 4195-4200, 4220, 4245
-
Downside Levels: 4170-ish, 4150-55 (big prior resistance)
QQQ & NQ
(Essentially unchanged) Not much more to say about these two. The Nasdaq has blown through every upside target we’ve laid out. Let’s let them reset before trying to re-engage.

NQ Daily
NQ — looking for a retest down to the 10-day ema at a minimum.
Open Positions
-
Bold are the trades with recent updates.
-
Italics show means the trade is closed.
-
Any positions that get down to ¼ or less (AKA runners) are removed from the list below and left up to you to manage. My only suggestion would be B/E or better stops.)
-
** = previous trade setup we are stalking.
Down to Runners in GE, CAH, LLY, ABBV, AAPL, MCD & BRK.B. Now Add META and AVGO.
-
CRM — Took time, but got our $207-$208 trim down, now down to about a 40% position after $212.50 touch. Probably down to ¼ position if we see $215-ish now, but want runners for potential push to $220.
a. Raise stops to Break-even.
-
UBER — long from $37.50 or just below — First trim $38.50-ish, second trim down to ½ position at $39 to $39.25.
a. Ideally we want $40 to $40.40 to get down to runners or out exit. Breakeven stops.
Go-To Watchlist
*Feel free to build your own trades off these relative strength leaders*
Relative strength leaders →
-
MCD, PEP & KO, WMT, PG — XLP
-
LLY, CAH
-
NVDA, CRM, AMD
-
MSFT, AAPL, META
-
LULU, CMG
-
FTNT
Relative weakness leaders →
-
PYPL
-
MET
-
CF, MOS
-
PFE
-
GLOB
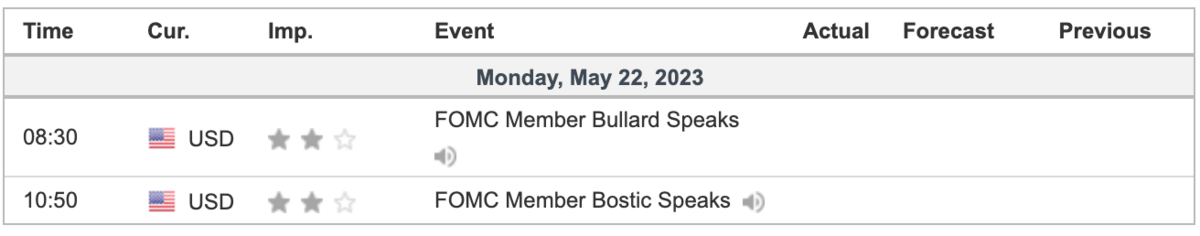
Economic Calendar
Just a couple of Fed heads…
Disclaimer: Charts and analysis are for discussion and education purposes only. I am not a financial advisor, do not give financial advice and am not recommending the buying or selling of any security.
Remember: Not all setups will trigger. Not all setups will be profitable. Not all setups should be taken. These are simply the setups that I have put together for years on my own and what I watch as part of my own “game plan” coming into each day. Good luck!
Update your email preferences or unsubscribe here
© The Opening Print
228 Park Ave S, #29976, New York, New York 10003, United States
No responses yet