Follow @MrTopStep and @BretKenwell on Twitter and please share if you find our work valuable.
Our View
I knew early that selling the rallies was not working. The traction simply wasn’t there and again, it’s a sign that the market is frustrating the masses.
The crowd was short — too short — the selling dried up after the gap down open and there were stops to run on the upside. That’s what we meant in yesterday’s View by saying, “at some point, the market will catch too many sellers offside and rip the S&P higher, just to shake out the weak-handed bears. Once that happens, we’ll get an idea of who’s going to take control.”
The ES took bad news and made good of it after Fed officials indicated they will have to raise interest rates to higher levels than they expected and Atlanta Fed President Raphael Bostic said he was “still very firmly” supporting raising interest rates in quarter-point increments.
With everyone off base and the ES already running downside stops the ES had no place to go but up. Is the decline over? I doubt that, but it’s been overdue for a pop after 3 weeks of selling off and after 7 declines in the last 9 sessions.
Our Lean
I always say if you want to know where the ES is going, you have to follow the money. The 3:50 MIM imbalances have all been to the sell-side. Look at the market’s record over the last week, two weeks and month. It’s all been net-sales — (That data is below in the MIM chart FWIW).
I know we talk a lot about the CHOP but a good example of this is last Friday the ES settled at ~3975 and yesterday it selled at 3983.
For all the hoopla and 20 to 40 point moves, here we are almost a week later and the ES is just 10 points off last Friday’s settlement. Based on all that, I think it’s fair to say we’re in a chop zone of 3920 to 4020.
Our Lean: I’m big on fading the gaps on Fry-days. Sometimes the gaps can be the most powerful of the week but I don’t think that will be the case today. If the ES gaps higher, I’ll lean into and buy the 30-point pullbacks. If we gaps down — which seems unlikely — I’ll buy the open and sell the early rallies, but I again think there could be some type of late-day options squeeze.
On the upside, watch 4000 to 4005 (there now). Above that puts 4025 +/- 5 points in play. On the downside, 3985 to 3990 is the first layer of support, followed by 3975.
Remember, I would like to be part of the larger moves, but in this tape especially, you have to take when the market gives you and move onto the next trade.
MiM and Daily Recap

The ES sold off down to 3925 on Globex and traded 3935 on Thursday’s regular session open. After the open, the ES made its day session low of 3931 at 9:35 and from there, it ran up to a high of 3954 at 11:00. Then, the ES chopped around for the next 2 hours and 20 minutes with a trading range of 3954 to 3942.25. Once it found its footing, the ES exploded into a rally to the session high of 3995 at 3:35.
The ES traded 3989.50 as the 3:50 cash imbalance showed $227 million to sell, dropped down to 3981.25 and traded 3983.25 on the 4:00 cash close. After 4:00 the ES traded between 3982.25 and 3985.50 and settled at 3983 on the 5:00 futures close, up 28 points or 0.7% on the day.
In the end, the ES gapped lower and rallied most of the day. In terms of the ES’s overall tone, it went from weak to firm but most of the buying was small stops and buy programs. In terms of the ES’s overall trade, volume was lower at 1.78 million contracts traded.
Technical Edge —
-
NYSE Breadth: 59% Upside Volume
-
Advance/Decline: 53% Advance
-
VIX: ~$19.50
Airline stocks reset nicely on the weekly charts and are trying to push higher. In fact, many names are set up quite nicely on a weekly basis. I will look to send an update in that regard, either today or this weekend (depending on today’s action).
TLT

TLT is gapping significantly higher today, regaining the February low and last week’s low at $100.28 in the process.
If it can hold today’s gains (and grow them), it could and should bode well for equities.
That said, notice the trend, which has been completely to the downside. I expect resistance at the 10-day.
S&P 500 — ES

Yesterday we said, “I don’t think we’ll see 4000 today, but if we do see it this week, then I believe it will be resistance. It’s also where the 10-day and 50-day MAs come into play.”
Well, we almost saw that level yesterday as the ES tagged 3995. So far, this level is holding as resistance, but if the bulls can continue yesterday’s momentum, we could push through this level today.
On the upside, I am watching the 10-day ema, as we are on the 10th session since touching this measure. Above that puts 4020 to 4030 in play, which has been resistance since Feb. 22nd.
Basically, can we clear one resistance zone (4000 to 4005) and get to the next (4020 to 4030)?
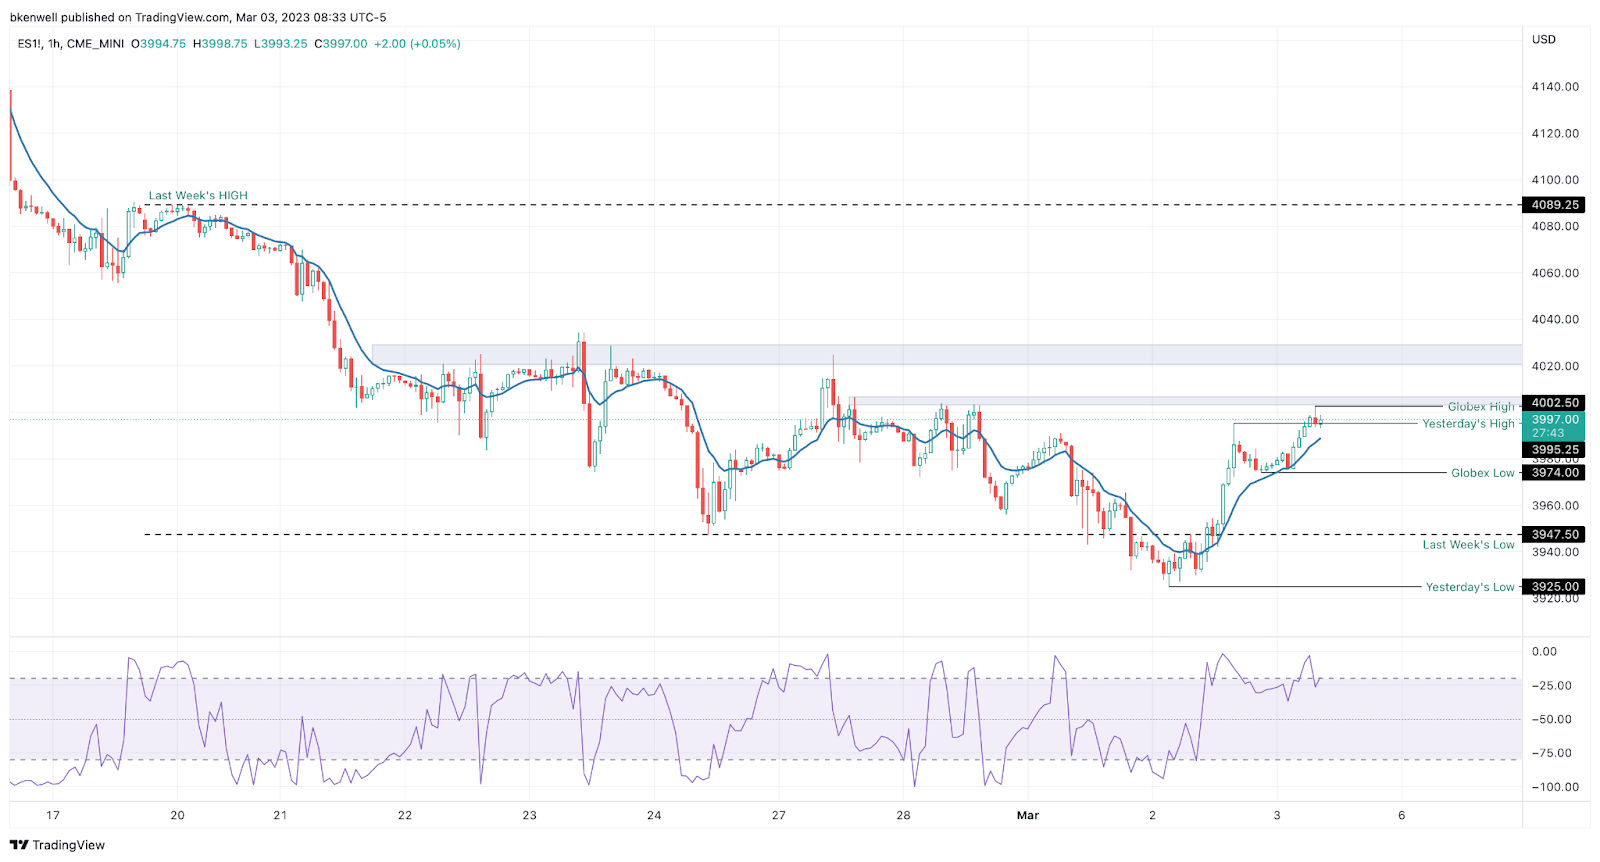
On the downside, bulls want to hold the 3985 to 3988 area as support. If they don’t, then 3975, then 3966 are in play.
SPY
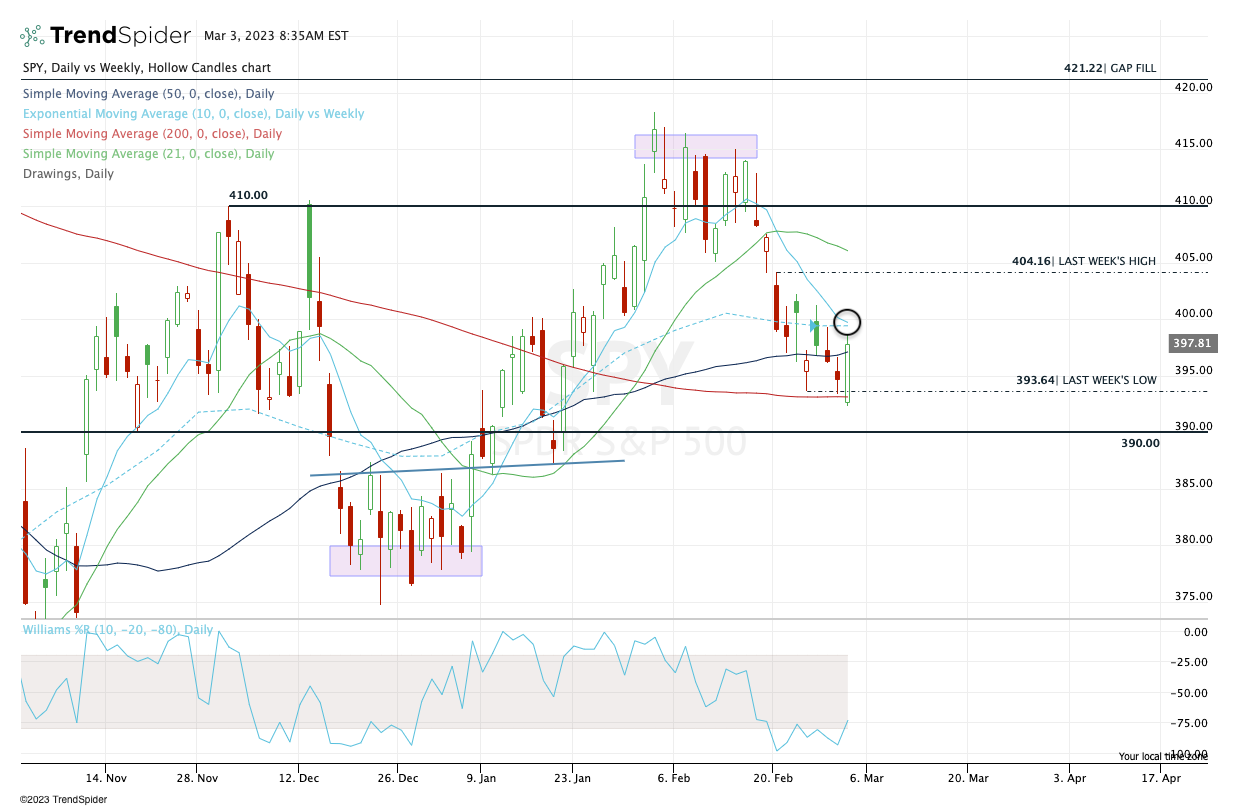
“The S&P is a bit oversold. If the S&P can regain yesterday’s low near $393.40, we could see a larger rebound ensue.”
The SPY bottomed at $392.30, regained $393.40, and pushed all the way to $398.70. That’s the type of trade we like to see.
I do think more upside is possible, but $400 is one heck of a test, IMO. There we find the 10-week and the 10-day moving averages, the latter of which we haven’t tested in 10 days now.
Clearly, we’re in a downtrend, but let’s see the reaction from the 10-day first.
~$404 is the 50% retrace of the decline and last week’s high. Below $396.50 is a negative development.
Open Positions
-
Bold are the trades with recent updates.
-
Italics show means the trade is closed.
-
Any positions that get down to ¼ or less (AKA runners) are removed from the list below and left up to you to manage. My only suggestion would be B/E or better stops.)
-
** = previous trade setup we are stalking.
-
MRK — Long from ~$110 — Initial stop can be as tight at $108 or as loose as $105, (trader’s preference). Initial target for ⅓ trim is $112.50.
-
DD — Long from $72.50. ⅓ Trim at $74+. Next trim spot $75 to $76 (aiming for $75.75).
-
Stop at $71 or B/E, whichever you prefer.
-
-
NVDA — I have just ⅕ of a position here, as it was initially a Red-2-Green trade and thus, just a day trade and we are swinging a partial of the position into Friday. As per the update: look to offer some near $235-36, then $238+
-
Stop at $229-ish. If healthy, it shouldn’t go below $230.
-
-
Natural Gas, UNG or /NG — is in a monthly-up rotation. If you have some, $10 is a trim spot for UNG. For /NG, it’s 2.95 to 3.00.
Go-To Watchlist
*Feel free to build your own trades off these relative strength leaders*
Relative strength leaders →
-
NVDA, CRM
-
PANW, FTNT
-
AQUA
-
SMCI
-
WYNN, LVS → would love a reset to the 10-week ema
-
GE → would love a reset to the 10-week ema
-
FSLR
-
AVGO
-
TSLA
-
SBUX, ULTA, NKE
-
AEHR → volatile!
-
MELI
-
AXP → would love a reset to the 10-week ema
-
BA & Airlines — AAL, DAL, UAL
-
CAT
Economic Calendar

No responses yet