Follow @MrTopStep and @BretKenwell on Twitter and please share if you find our work valuable.
Our View
Keeping things short and simple for the View. The market continues to slowly trickle lower. Surprisingly, it’s frustrating both sides.
The bulls are frustrated for obvious reasons: They are looking for a bounce that simply hasn’t materialized, as the S&P is quietly working on its fourth straight weekly decline.
Many of the bears are frustrated too — surprisingly — because even though the index is decline, it continues to give us “false breakdowns,” where the S&P doesn’t gain much downside momentum. It’s been a series of mild dips dragging us down.
While I do believe we will go lower overall, at some point, the market will catch too many sellers offside and rip the S&P higher, just to shake out the weak-handed bears. Once that happens, we’ll get an idea of who’s going to take control.
Our Lean
In the world of stocks and bonds, things are not doing so well. The ES and NQ are down and struggling to bounce, while the bonds are falling and pushing the 10-year Treasury yield back above 4%.
The ES traded down to 3925 on Globex and is currently trading 3941 as I write this (Wednesday evening). It’s obvious that high yields are weighing on the market again — and they should be!
Our Lean: The ES has been down 7 out of the last 9 sessions and at least initially should hold the 3900-3920 level (it held 3925 overnight). Today I’m looking to buy the early pullbacks and sell the rallies.
As for levels, 3925 to 3920 will be key early. On the upside, 3945 to 3950 has been resistance overnight and bulls will have to crack that zone to have any sustainable rallies to the upside.
MiM and Daily Recap
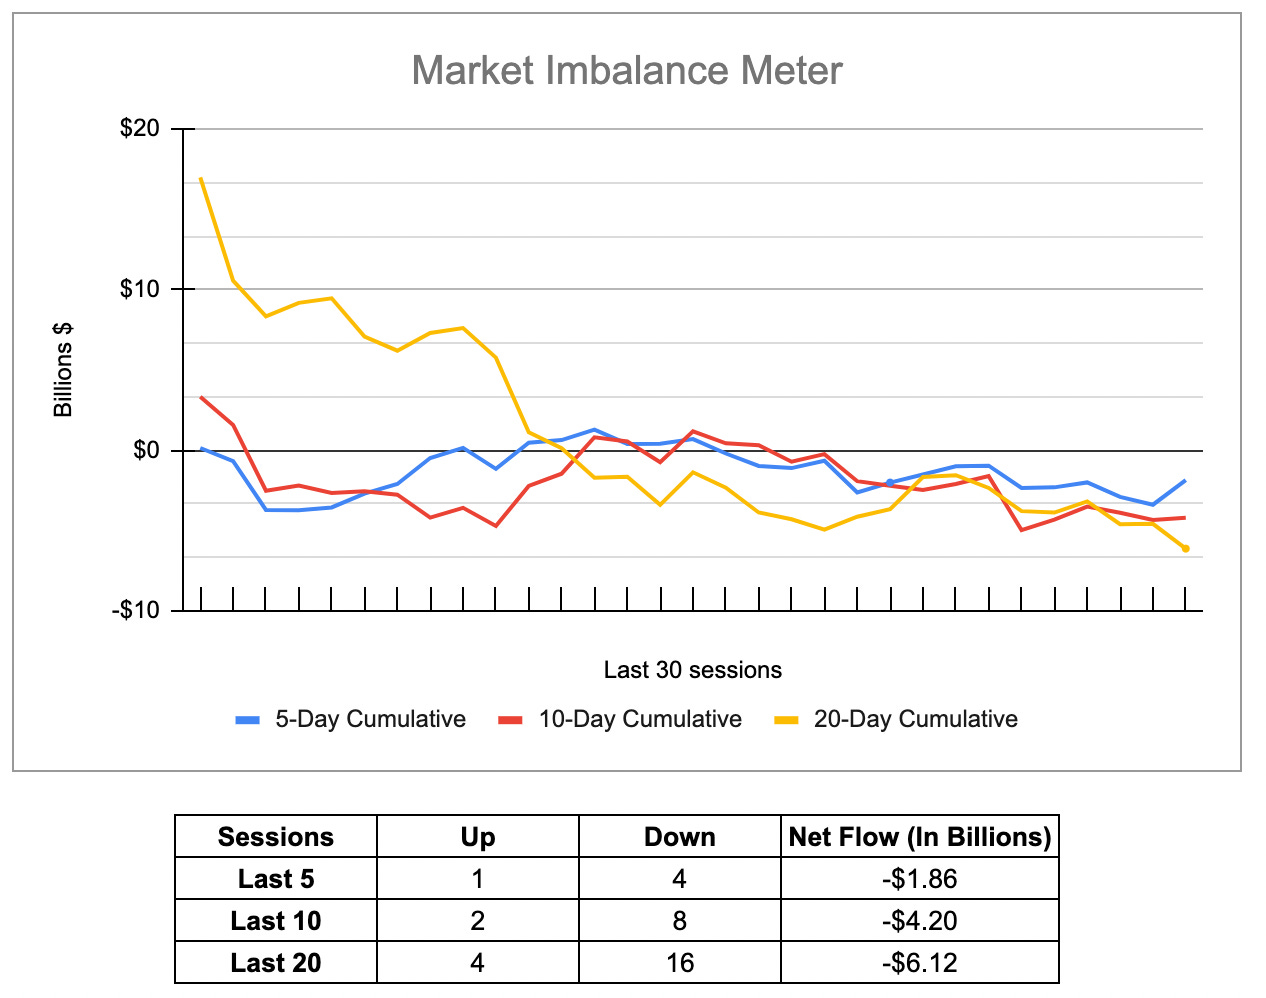
The ES traded up to 3991 on Globex and opened Wednesday’s regular session at 3984. After the open, the ES pulled back down to 3961, rallied up to 3975 at 9:50 and then reversed back down to 3950. Then rallied up to a lower high at 3968.50 at 10:45. After the push, the ES reversed again down to a new daily low at 3943 at 11:20.
After the low, the ES rallied back up to another lower high at 3974 at 12:10 and then stutter-stepped back down to a higher low at 3947.75 and rallied up to 3961.75 at 3:38 as the early MIM showed $250 million to sell. The ES traded 3960 at 3:50 as the MIM showed $72 million to sell, which quickly grew to $400 million for sale and traded 3957.75 at 4:00. At 5:00, the ES settled at 3961, down 19 points or 0.5%.
In the end, we had some big intraday moves, but neither the bulls nor the bears won. In terms of the ES’s overall tone, it was weak but not overly weak — more like it lacked strength. In terms of the ES’s overall trade, volume was higher at 1.97 million contracts traded.
Technical Edge —
-
NYSE Breadth: 45% Upside Volume
-
Advance/Decline: 43% Advance
-
VIX: ~$21
TLT

We highlighted the TLT the other day, but it needs to be talked about again. A decline in bonds could be or is foreshadowing the decline in equities. That’s as Treasury yields continue to rise.
Remember, when the SPX hit its 52-week low in October, the 10-year yield was at 4.33%. Currently, that figure is at 4.07 and in a “full on breakout.”
Yesterday the TLT bounced off $100 and held the weekly/monthly down level at $100.28. Today it’s not so lucky, gapping down to about $99. If it can’t regain the aforementioned levels, the mid-$90s are in play.
S&P 500 — ES
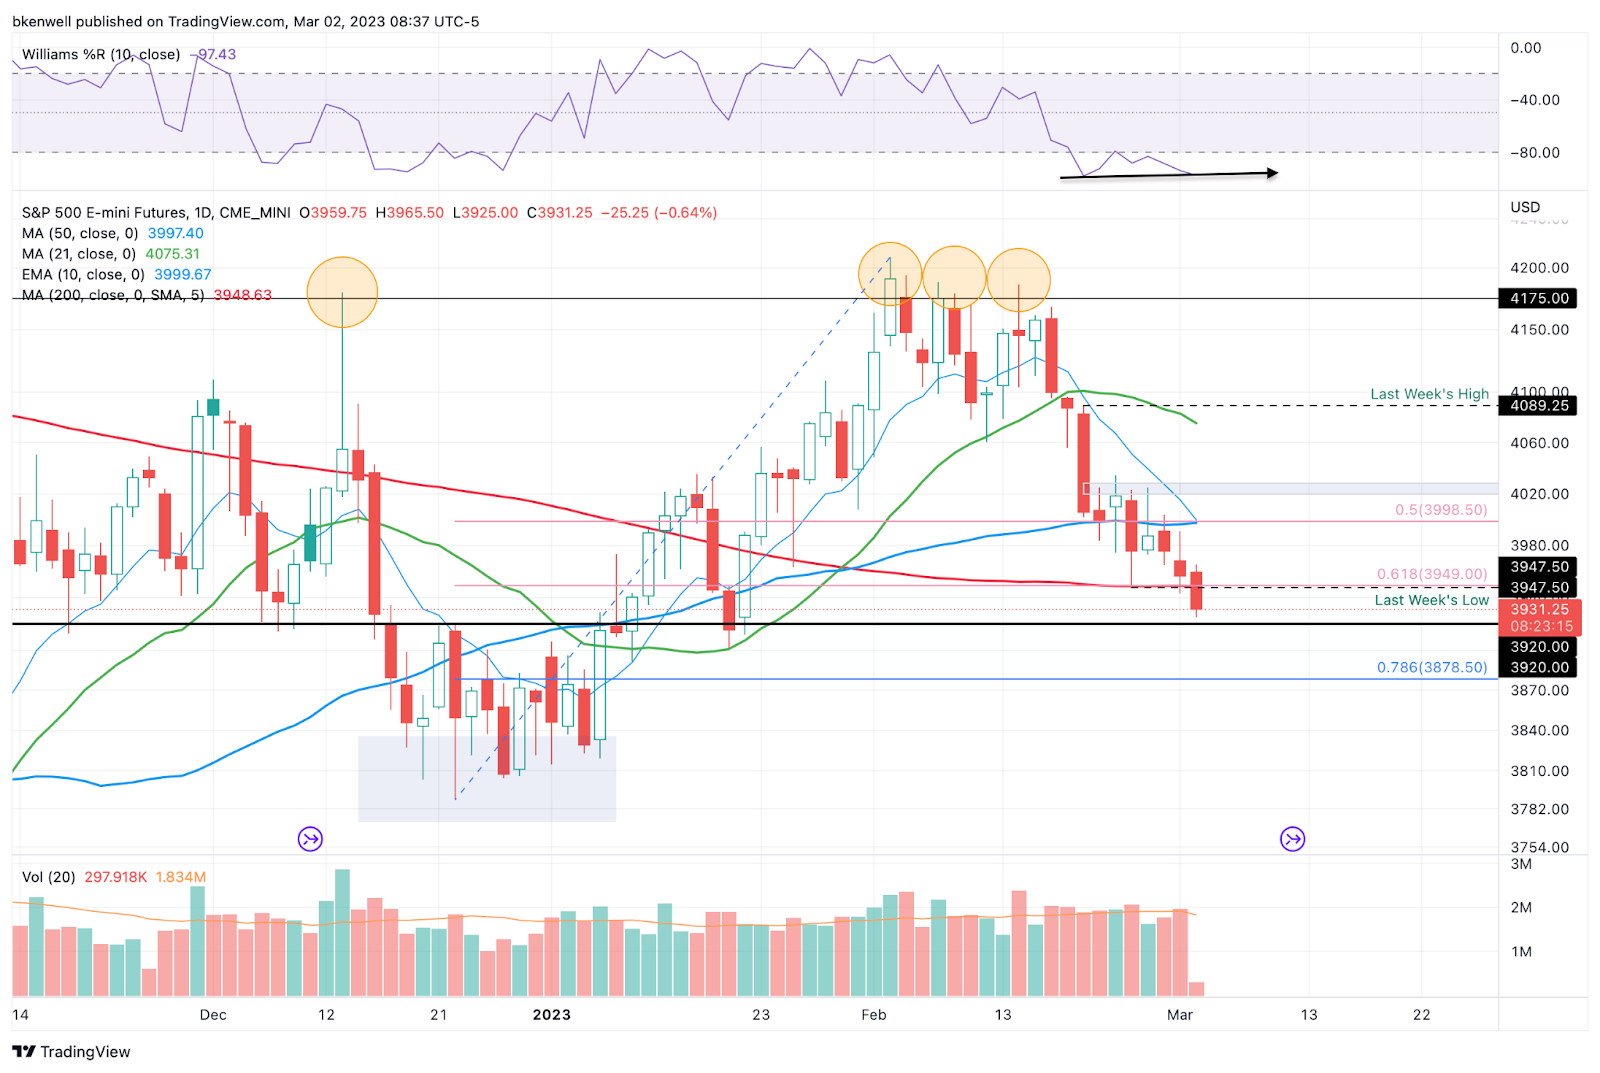
The ES did a great job bouncing off the 61.8% + 200-day sma last week, then held this level yesterday as well.
On the upside, I don’t think we’ll see 4000 today, but if we do see it this week, then I believe it will be resistance. It’s also where the 10-day and 50-day MAs come into play.
On the downside, 3920 is the first level of support. 3900 is below that, followed by 3878.
SPY
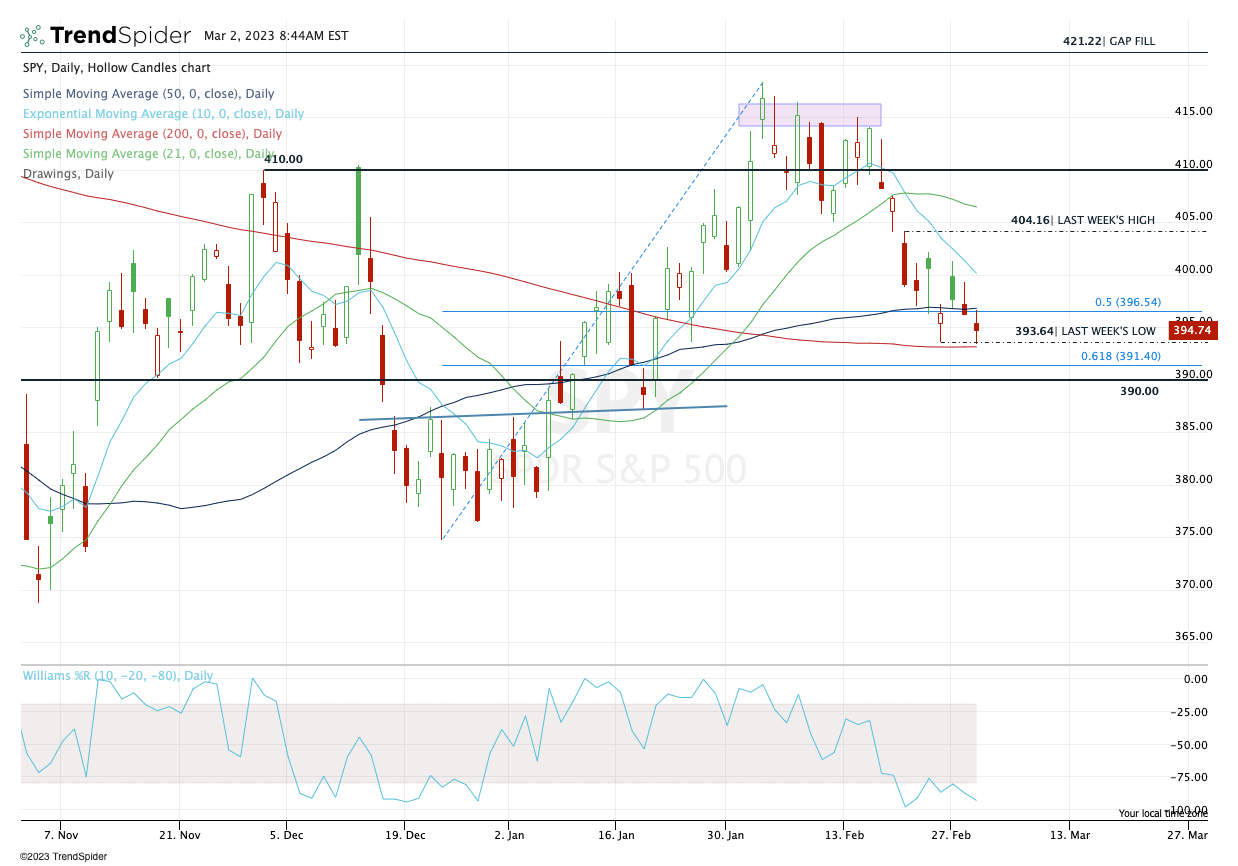
As much as the “bigger picture” is aligning for the bears, The S&P is a bit oversold. If the S&P can regain yesterday’s low near $393.40, we could see a larger rebound ensue.
If this level is resistance or can’t be regained, then the SPY could be heading into the $390 to $391.50 zone.
On the upside, notice how $396.50 continues to “act important.” It has been dancing around this level as support and resistance for a week+ now.
TSLA
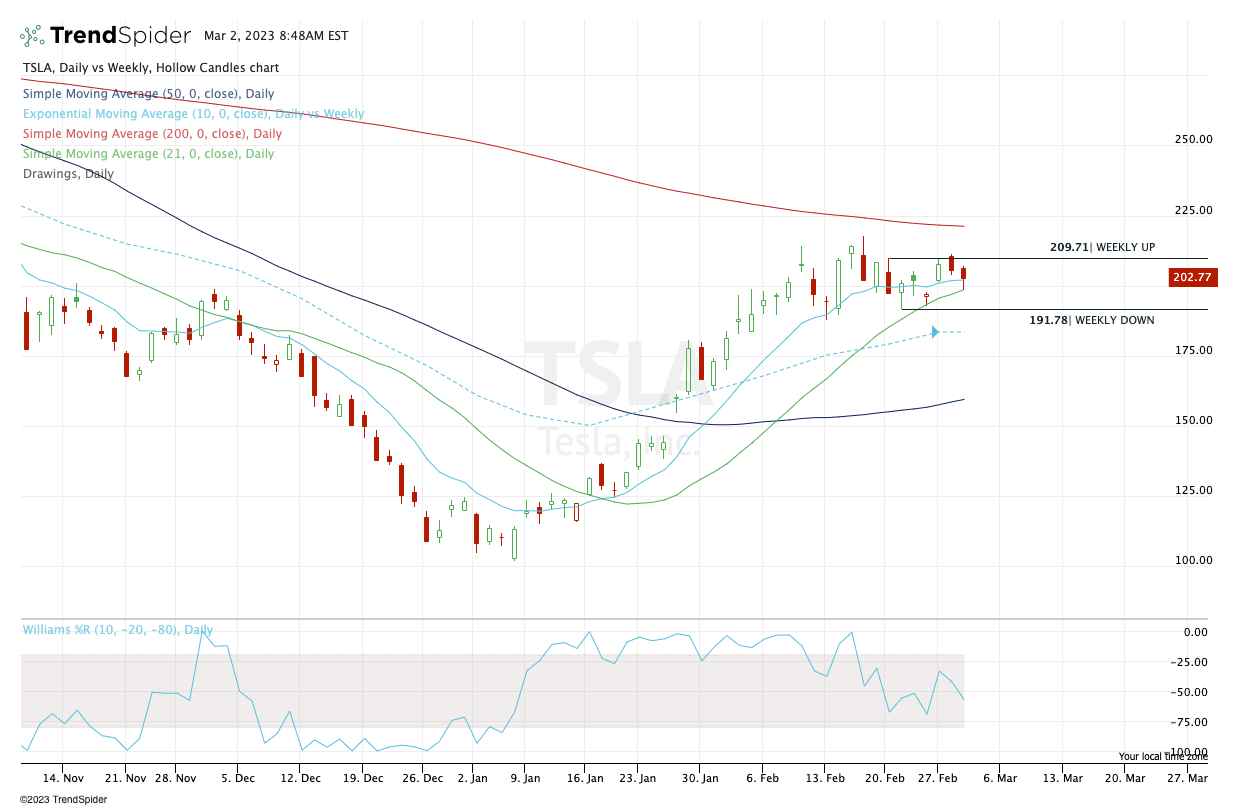
TSLA is getting crushed in the pre-market, down about 8%. Keep an eye on that 10-week moving average, down in the low-$180s. If we tagged that level, let’s see if TSLA can put together a bounce.
Keep last week’s low in mind on the upside as the “need to regain” level, at $191.78.
Note: This does not need to be a trade for anyone. It can simply be used as a barometer, as TSLA and NVDA have been market leaders amid this rally.
NVDA
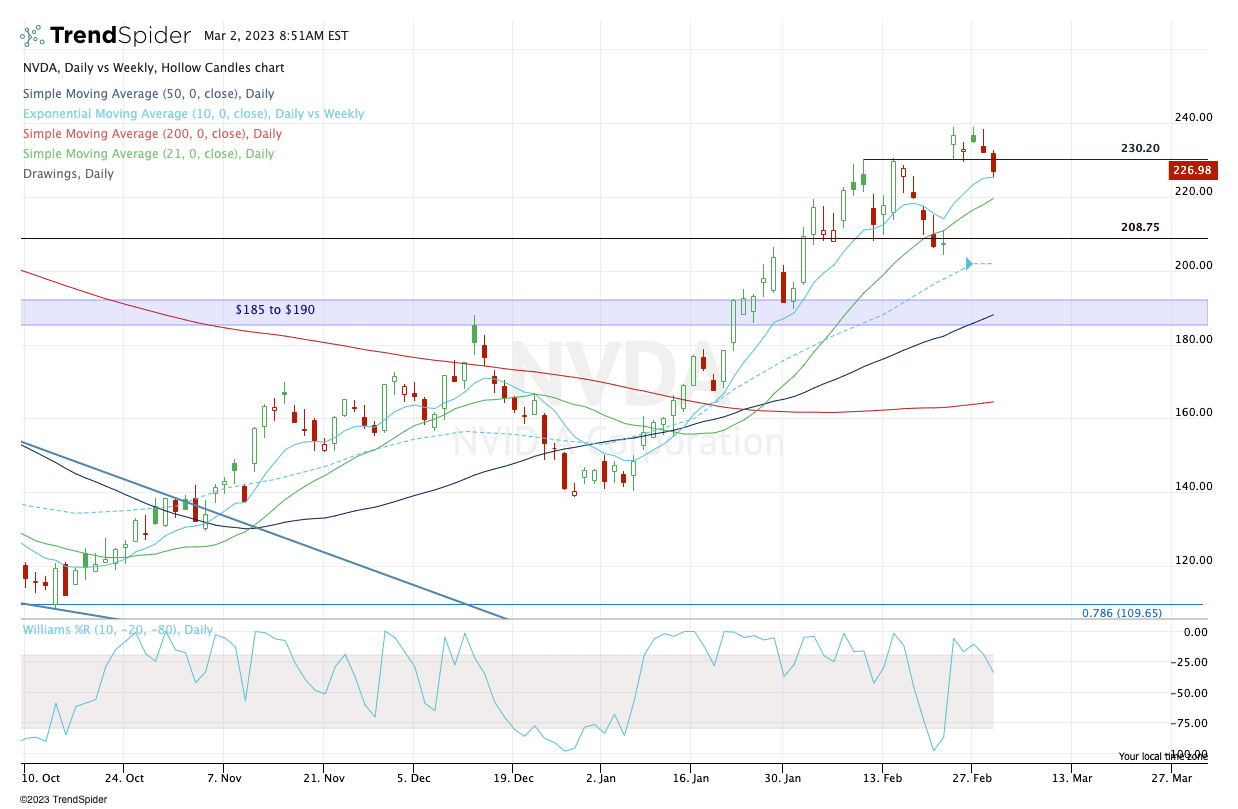
Speaking of NVDA, is the third time a charm? It couldn’t hold $230 yesterday, so we couldn’t stay long even for a day trade.
It’s now tagging the 10-day ema after a huge EPS rally and gapping just below yesterday’s low this morning. That level is at ~$225.
If the losses are shallow today — currently trading ~$224 in the pre-market — then a regain of $225 could kickstart a nice Red-2-Green cash flow day trade and if it gains momentum, we can take some profit and look to swing the rest.
I’ll send an update if that’s the case.
Natural Gas — NG or UNG
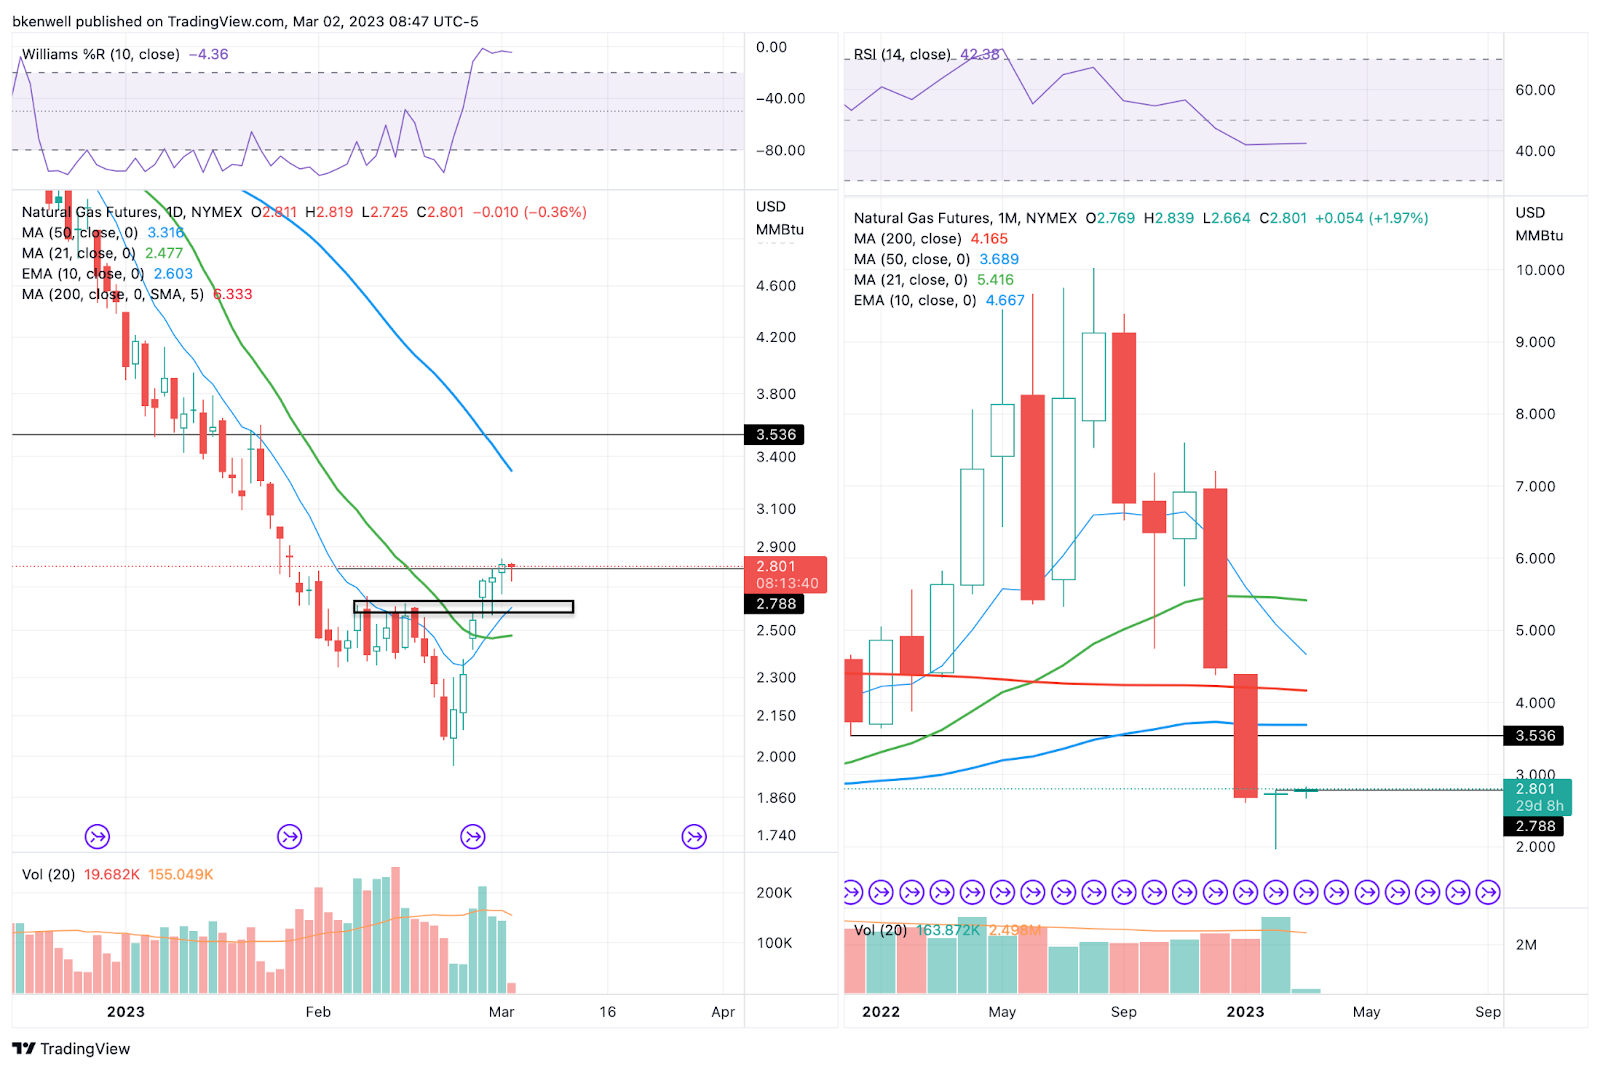
Not long ago, we were looking for a weekly-up rotation in Nat Gas, but the trade never fired as it broke down to new lows. What’s happened since has been nothing short of amazing as NG has stormed back to life.
You can use NG or UNG and feel free to not trade it, but that monthly candle (on the right) is a thing of beauty.
Over $2.788 and it’s hard to be bearish on Natty Gas, as it looks like it wants to push up toward the 50-day.
Conversely, you can see how it handles a pullback to the $2.60-ish area.
Open Positions
-
Bold are the trades with recent updates.
-
Italics show means the trade is closed.
-
Any positions that get down to ¼ or less (AKA runners) are removed from the list below and left up to you to manage. My only suggestion would be B/E or better stops.)
-
** = previous trade setup we are stalking.
-
MRK — Long from ~$110 — Initial stop can be as tight at $108 or as loose as $105, (trader’s preference). Initial target for ⅓ trim is $112.50.
-
DD — Long from $72.50. ⅓ Trim at $74+. Next trim spot $75 to $76.
-
Stop at $71 or B/E, whichever you prefer. Slow mover, apparently.
-
Go-To Watchlist
*Feel free to build your own trades off these relative strength leaders*
Relative strength leaders → So much strength amid market fade.
-
NVDA, TSLA → Robust
-
AQUA
-
AEHR
-
GE → would love a reset to the 10-week ema
-
SBUX
-
MELI
-
WYNN, LVS → would love a reset to the 10-week ema
-
AXP → would love a reset to the 10-week ema
-
BA & Airlines — AAL, DAL, UAL
-
TJX, ULTA, NKE
-
CAT
-
HCCI
-
XLE — XOM, CVX, COP, BP, EOG, PXD — (Weekly Charts)
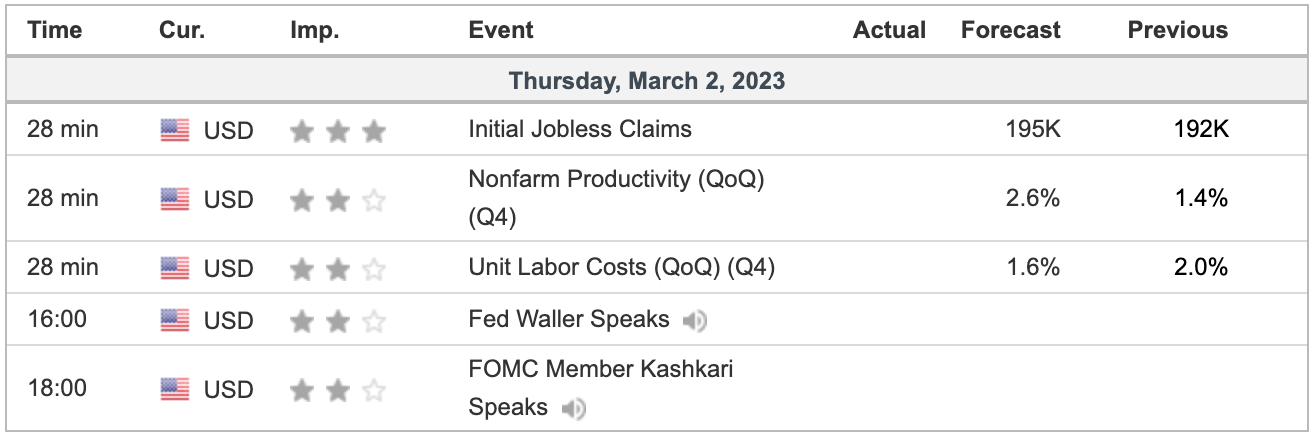
Economic Calendar
No responses yet