Follow @MrTopStep and @BretKenwell on Twitter and please share if you find our work valuable.
Our View
After 3 weeks of selloffs and failed rallies, the ES rallied 128 points in two days. It kinda works this way and that’s why I didn’t get overly bearish. It’s why on Wednesday, we wrote:
“At some point, the market will catch too many sellers offside and rip the S&P higher, just to shake out the weak-handed bears. Once that happens, we’ll get an idea of who’s going to take control.”
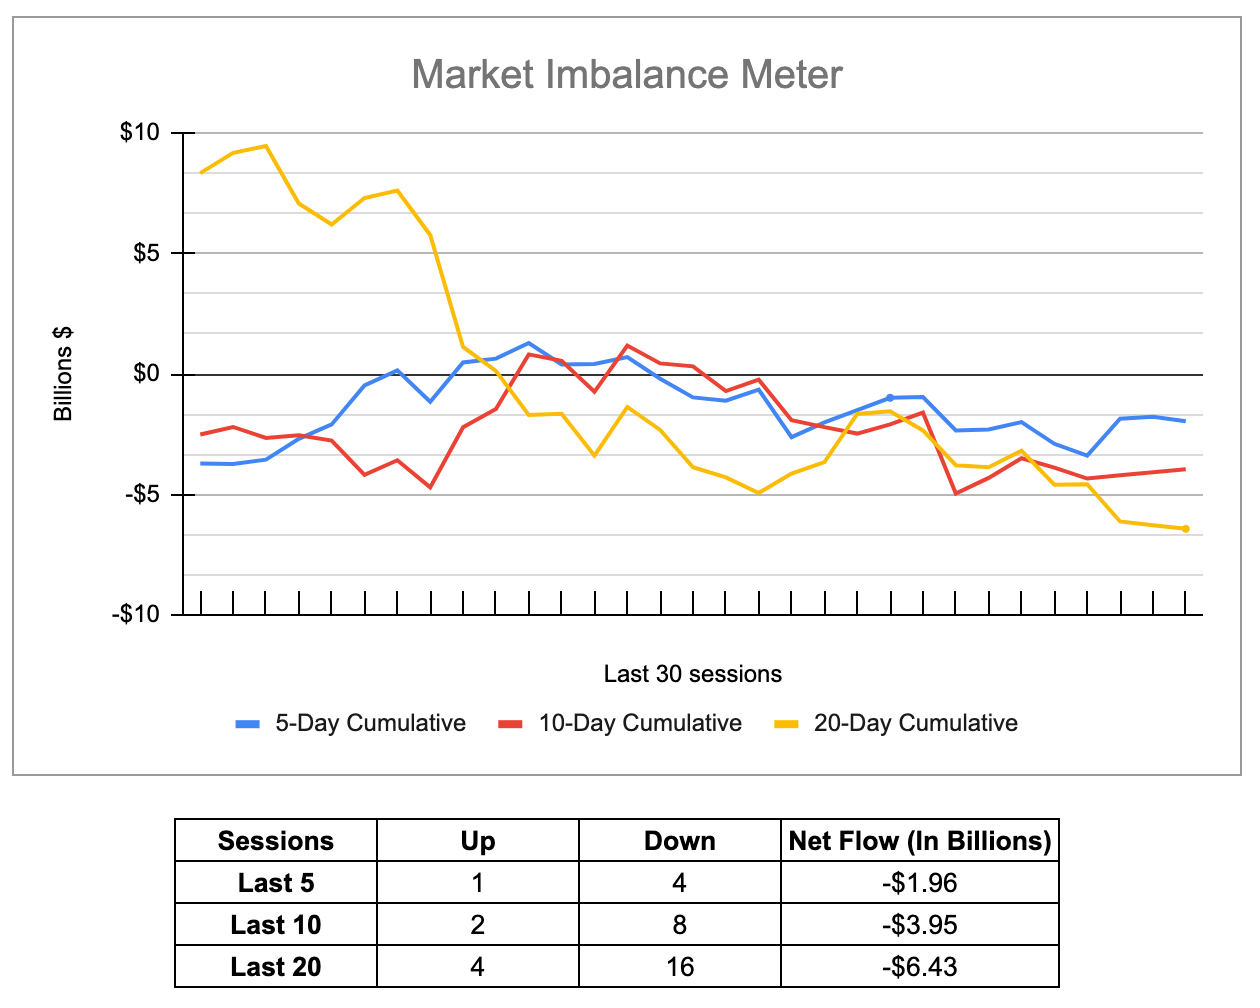
My question is, how many times have we seen this? As I have said many times, it takes days and weeks to knock the ES down and only one to bring it back. I am 100% convinced that the programs know when everyone is hedged up and rolled their options positions down and off base, and they use the options expiration to jam it the other way. On top of it all…the MIM was $1 billion to sell and volumes were low.
Looking ahead, Powell will speak before the Senate Banking Committee and House Financial Services Committee on Tuesday and Wednesday morning, while the ADP’s private payroll report for February and the JOLTS job openings is also on Wednesday.
Wednesday also has a 10-year Treasury auction. On Friday, we get the monthly non-farm payrolls report.
Our Lean
This week is going to be an overload. If the ES is going up, it’s going to have to get past a ton of data and headlines. Powell is sure to attract some attention throughout the week, whether he wants it or not.
Our Lean: Friday’s lean for a “late-day options squeeze” helped give traders a nice payout ahead of the weekend. Now though, MrTopStep has a trading rule that the ES tends to go sideways to down after a big up day. That doesn’t mean the ES can’t rally, I just don’t think it will go up much.
MiM and Daily Recap
The ES traded up to 4011 on Globex and opened Friday’s regular session at 4005. After the open, the ES sold off down to 3999.25, rallied up to 4017.25 and then sold off down to 3999 at 10:00. After the drop, the ES rallied back up to 4022 at 10:25, pulled back to the 4019 area and rallied up to 4040.50 going into 1:10.
After a small pullback (there hasn’t been anything over 5 points), the ES rallied up to a new high at the 4046.25, dipped a few points and traded back up to a new high at 4047 at 2:52 and then up to 4053.00 at 3:10. It traded 4045.75 as the 3:50 cash imbalance showed about $1 billion to sell. The ES traded 4049.25 on the 4:00 cash close and settled at 4052.50 on the 5:00 futures close, up 67.75 points or +1.70% on the day.
In the end, the ES lived up to its Friday reputation. In terms of the ES’s overall tone, it was firm. In terms of the ESs overall trade, volume was steady but not high considering the size of the rally, at 1.57 million contracts traded.
Technical Edge —
-
NYSE Breadth: 83% Upside Volume
-
Advance/Decline: 81% Advance
-
VIX: ~$19.00
Longs would have liked to see a slightly lower open, given them an opportunity to buy the dip and charge the S&P higher. A gap-up makes that harder.
S&P 500 — ES
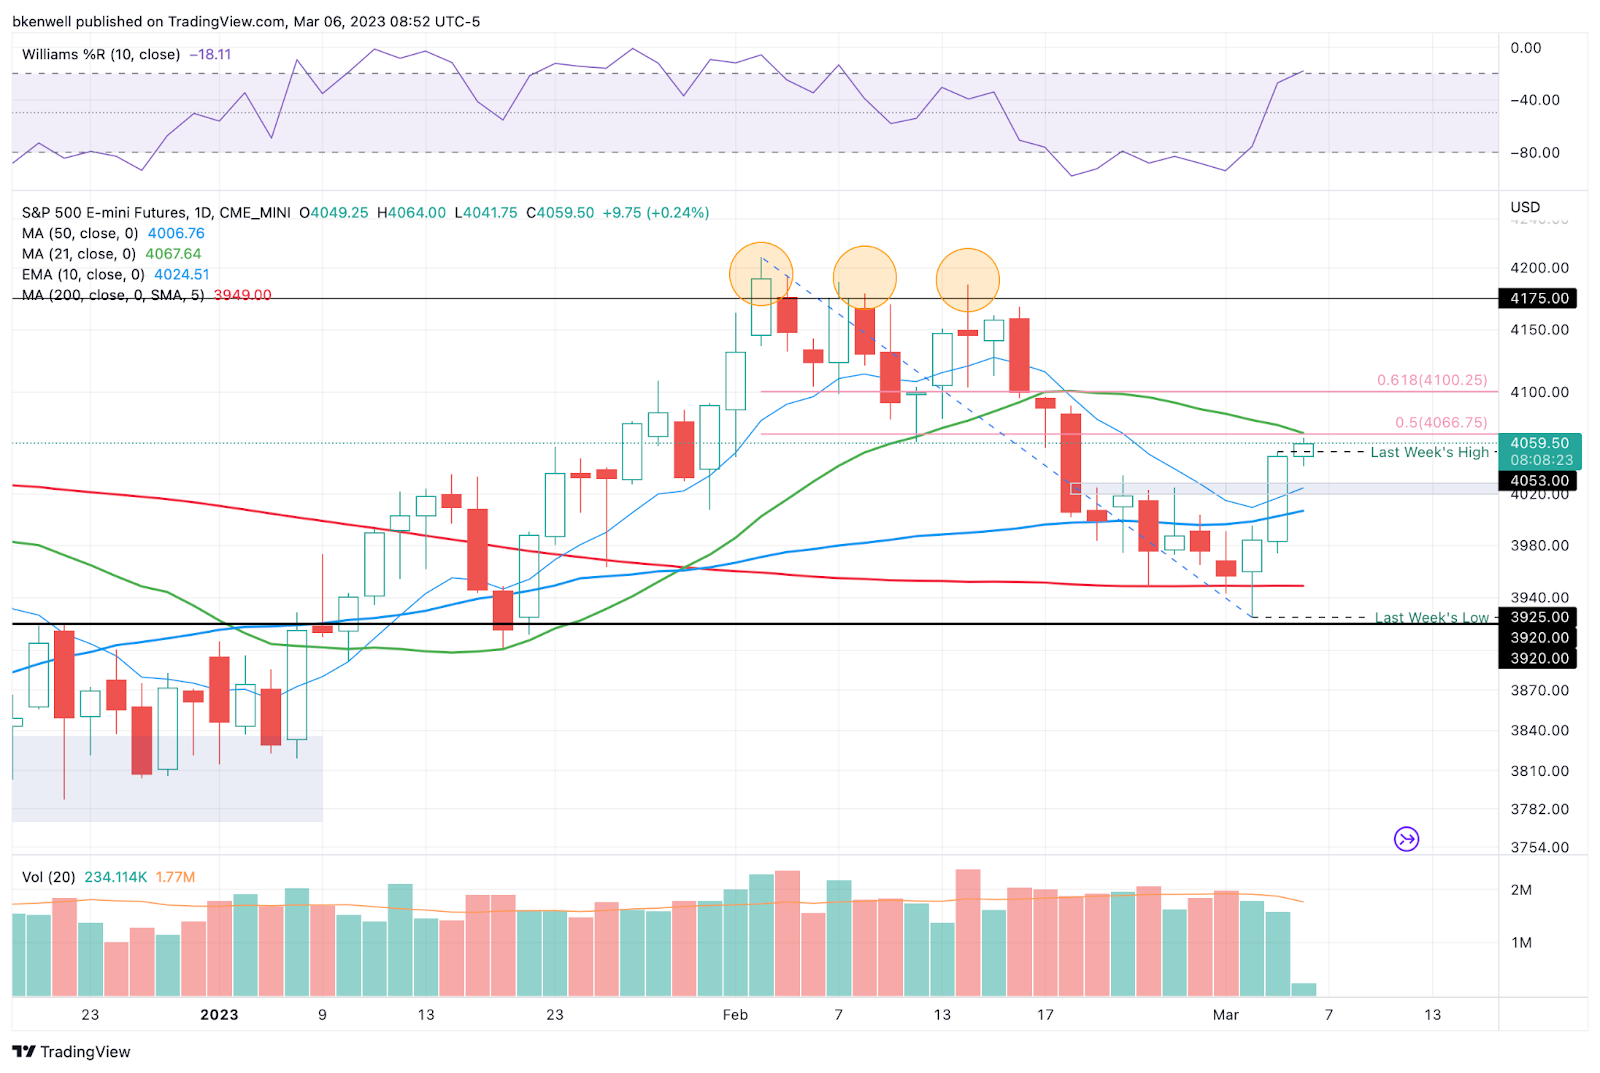
Nice Globex push, but the 21-day sma and 50% retrace for the 2023 range come into play at ~4067 to make things a bit trickier.
Above 4067 opens the door to 4100.
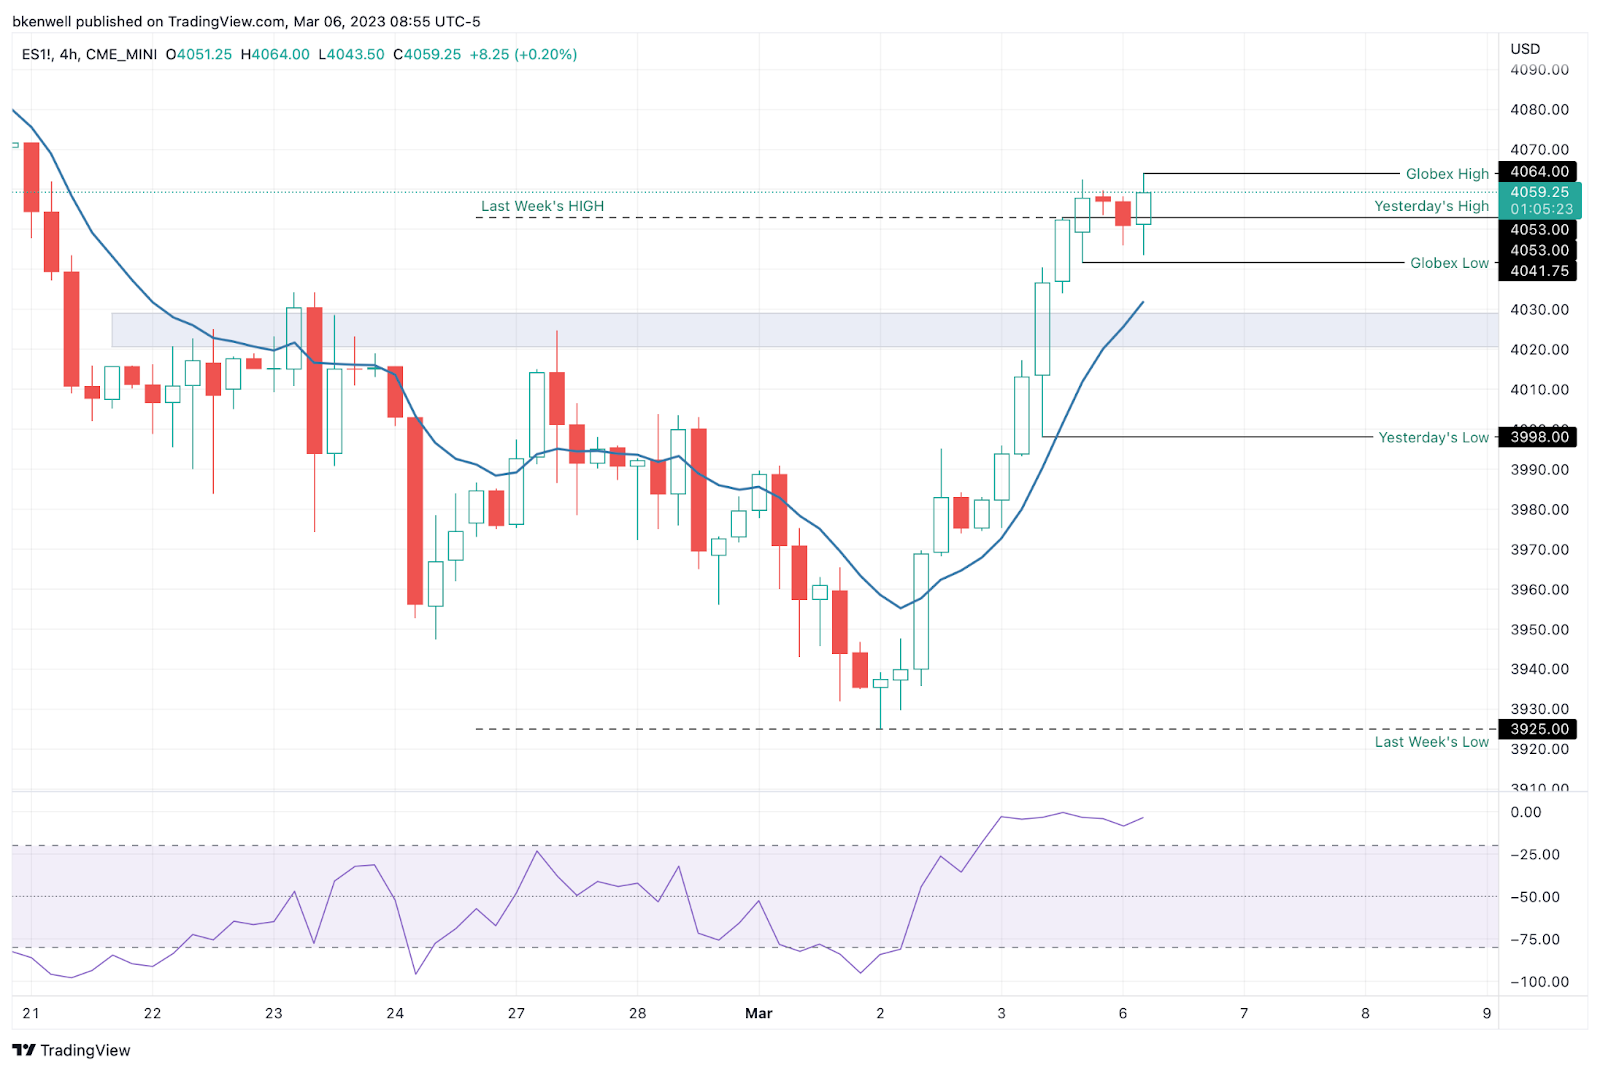
On the downside, initial support is down in the low-4040s. Below that and see if the 10-ema on the 4-hour chart can buoy the ES (shown below)
SPY
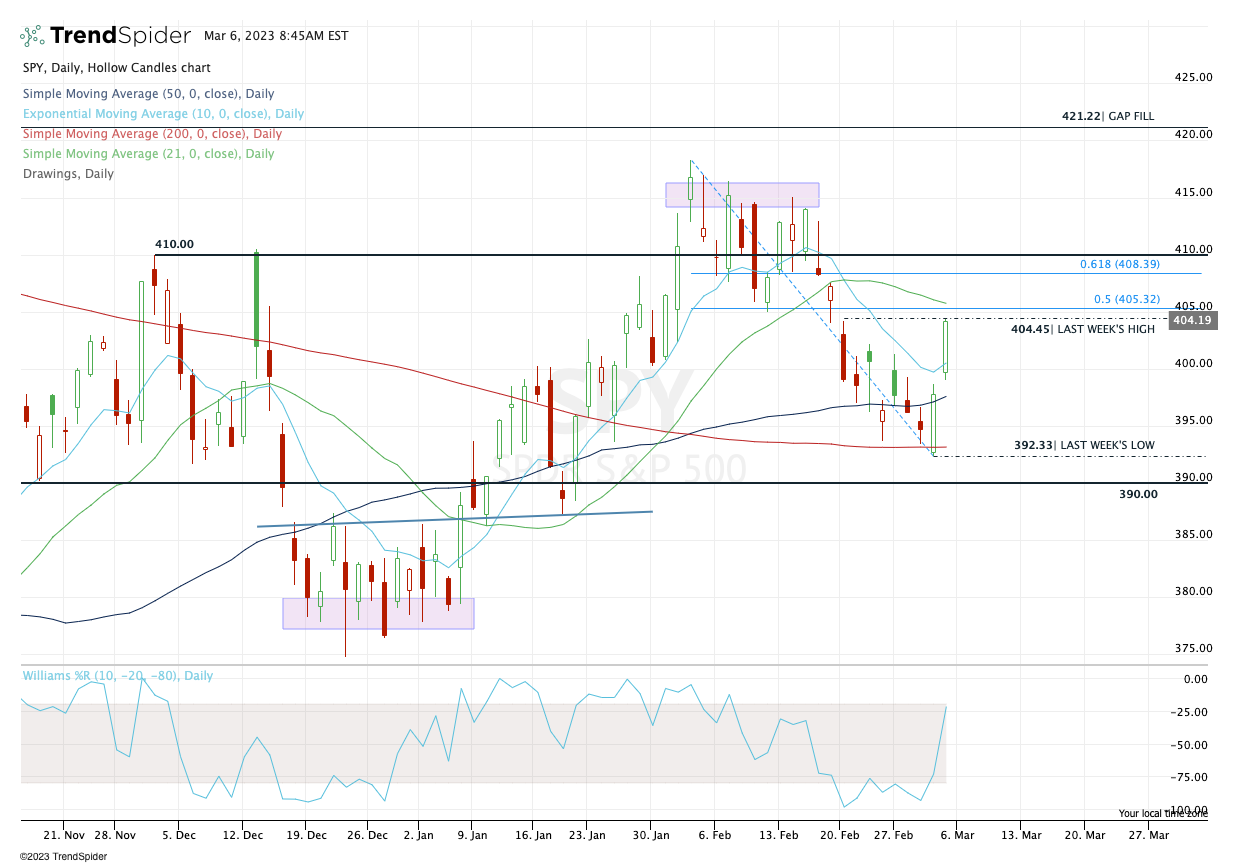
Weekly-up over ~404.50 (which is actually like two-weeks worth of highs) puts $405.30 to $405.60 in play.
There we find the 50% retrace and the 21-day sma. Above that puts $408.50 to $410 in play.
On the downside, as anecdotal as it sounds, I want to see a test and hold of the 10-ema on the 30-min or 1-hour timeframes.
Nat Gas — /NG
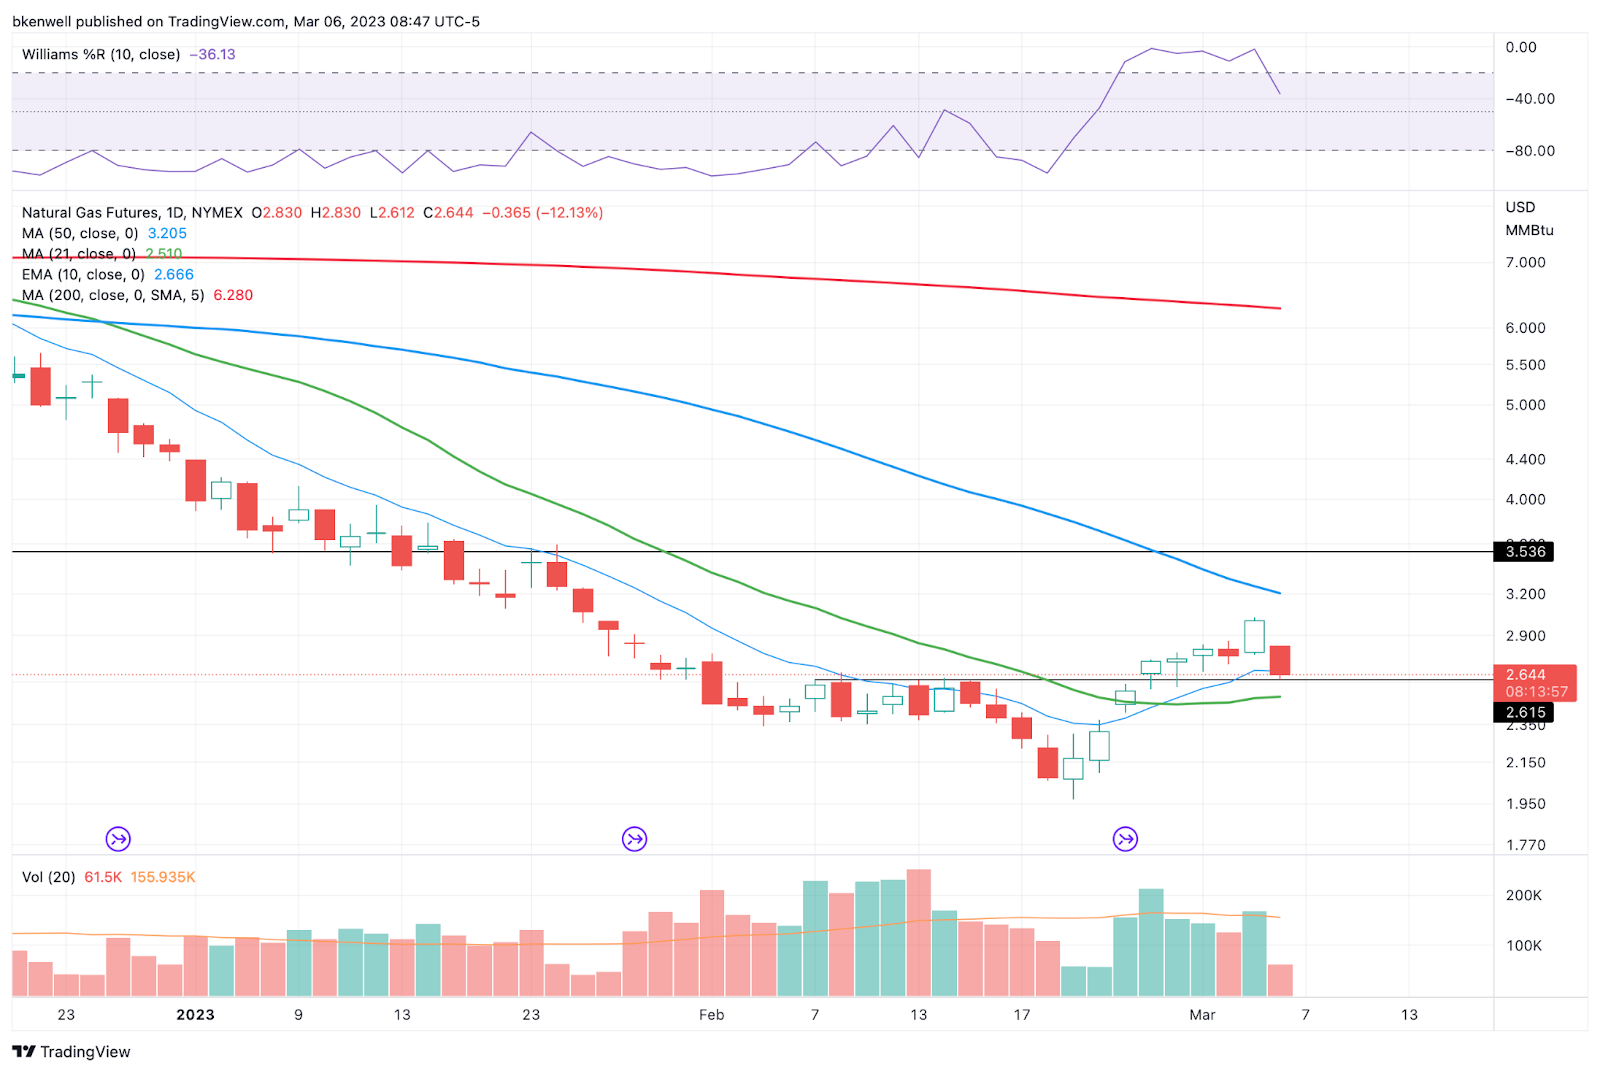
Remember that /NG can be a very volatile, tough futures contract to own – particularly in small accounts.
On Friday, we said to trim NG into the $3 area and UNG into the $10 area (both in our trade section and in a rare video on Twitter). Now though, NG is pulling back into a potential support zone.
That’s near the $2.65 level and the 10-ema. Bulls really do not want to see NG close below $2.50 (the 50% retracement) and 21-day sma.
On the upside, I’d love to see a push up through last week’s high and a tag of the 50-day.
AMD

Steady pullback to the 10-week and 200-week moving averages and an inside week.
If AMD can go inside-weekly-up over $81.63, bulls can search for a rally toward $84 as their first upside target.
As for a stop-loss, a $6 stop is fairly wide. If you go that route, size correctly, as I don’t typically like rotations at the start of the week. Perhaps consider ⅓ or ½ size initially, then consider a full-size position if we can close above $81.63 on a daily basis.
Open Positions
-
Bold are the trades with recent updates.
-
Italics show means the trade is closed.
-
Any positions that get down to ¼ or less (AKA runners) are removed from the list below and left up to you to manage. My only suggestion would be B/E or better stops.)
-
** = previous trade setup we are stalking.
-
MRK — Long from ~$110 — Initial stop can be as tight at $108 or as loose as $105, (trader’s preference). Initial target for ⅓ trim is $112.50.
-
DD — Long from $72.50. Down to ½ position. Prefer a ⅓ trim at $76.50+
-
Stop at $71 or B/E, whichever you prefer.
-
-
NVDA — I have just ⅕ of a position here, as it was initially a Red-2-Green trade and thus, just a day trade and we are swinging a partial of the position into Friday. As per the update: look to offer some near $235-36, then $238+
-
Beautiful, textbook trade.
-
-
Natural Gas, UNG or /NG — is in a monthly-up rotation. If you’re in it, first target is UNG at $10 or NG at 2.95 to 3.00.
-
First target hit on Friday! If you’re weren’t in, it has a nice reset back down to the breakdown area (outlined above in the charts).
-
Go-To Watchlist
*Feel free to build your own trades off these relative strength leaders*
Relative strength leaders →
-
NVDA, CRM
-
PANW, FTNT
-
AQUA
-
SMCI
-
WYNN, LVS → would love a reset to the 10-week ema
-
GE → would love a reset to the 10-week ema
-
FSLR
-
AVGO
-
TSLA
-
SBUX, ULTA, NKE
-
AEHR → volatile!
-
MELI
-
AXP → would love a reset to the 10-week ema
-
BA & Airlines — AAL, DAL, UAL
-
CAT
Economic Calendar

No responses yet